![]()
1
What Is This Thing Called the Theory of Constraints?
In the 1980s, Dr. Eliyahu M. Goldratt and Jeff Cox introduced us to their Theory of Constraints (TOC) improvement methodology through their highly successful and widely read business novel, The Goal [1]. Goldratt and Cox explained to us that systems are comprised of interdependent processes and functions which they equated to a chain. They explained that every chain has a weakest link, and in order to strengthen the total chain, you must first identify this weakest link and then focus your improvements on it until it is “broken.” And when it does break, a new constraint will appear immediately. They further explained that any attempts to strengthen the other links in the chain will not result in a stronger chain because it will still break at the weakest link.
Goldratt and Cox analogized the concept of a chain to organizations and explained that failing to identify and strengthen the organization’s weakest link, or system constraint, will not strengthen the global system. Similarly, attempts to improve non-constraint operations will not necessarily translate into significant organizational improvement resulting in profitability improvement. It’s kind of like a professional baseball team signing free-agent sluggers when the real constraint is relief or starting pitching. They can score lots of runs, but in the end, if they can’t hold the other team to fewer runs than they score, they’ll never win a pennant.
According to Dettmer [2] and Goldratt and Cox [1], the Theory of Constraints is based upon the fact that there is a common cause for many effects we observe at the systemic or organizational level. TOC envisions a company as a system, or a set of interdependent relationships, with each relationship being dependent on others in some way. The global system performance is dependent upon the combined efforts of all of the relationships within the organization. In addition, there are disruptions and statistical fluctuations (i.e. variability) that interfere with the production and delivery of products to the next process step that ultimately impact delivery to the customer. It’s important to understand that every for-profit organization has the same two goals, to make money now and to make money in the future. Therefore, every action or decision taken by an organization should be judged by its impact on “the organization’s goals.” This, of course, implies that before we can do this, we must first define the goal and, second, determine how we are going to measure or judge our decisions and actions.
While Goldratt and Cox used a chain analogy to define what a constraint is, I use a different approach when explaining TOC to people who aren’t familiar with what it is. As I present this different approach, remember that the Theory of Constraints is a methodology for identifying the most important limiting factor (i.e. constraint) that stands in the way of achieving your goals and then systematically improving that constraint until it is no longer the limiting factor. So, let’s look at a different way of describing TOC.
The Concept of the System Constraint
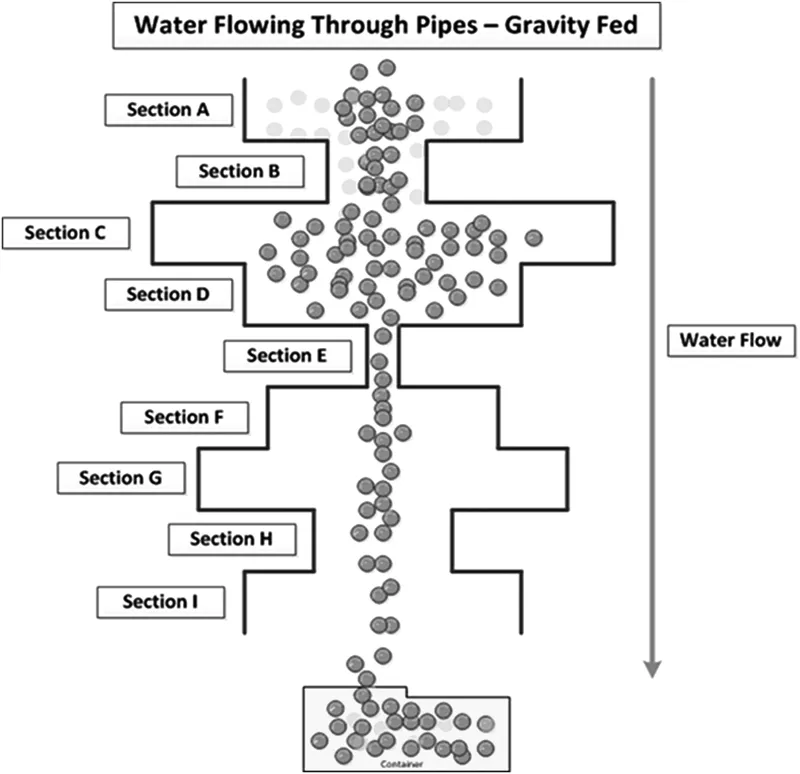
Figure 1.1 is a simple piping system used to transport water. Water enters into Section A of this piping system, then flows into Section B and continues downward through all of the pipes until it collects in the receptacle at the base of the system. In this piping system, water flows via gravity, meaning that if you wanted more water, you could not increase the pressure to get more. In every system, there is a point that limits throughput and this piping system is no different. Think for a minute what you would have to do to achieve an increase in the flow of water through this system? Because Section E’s diameter is the smallest, does it make sense to you that if you wanted to increase the flow of water through this system, the only way you could achieve this would be to increase the diameter of this limiting point? In other words, Section E is limiting the flow of water (i.e. throughput) through this piping system and because of this, it is designated as the system constraint (aka the bottleneck). Now ask yourself what would determine how much larger Section E’s diameter must be? The answer to this basic question is that it depends upon how much more water is needed. In other words, it’s dependent upon the new demand requirement.
FIGURE 1.1
Piping system used to transport water.
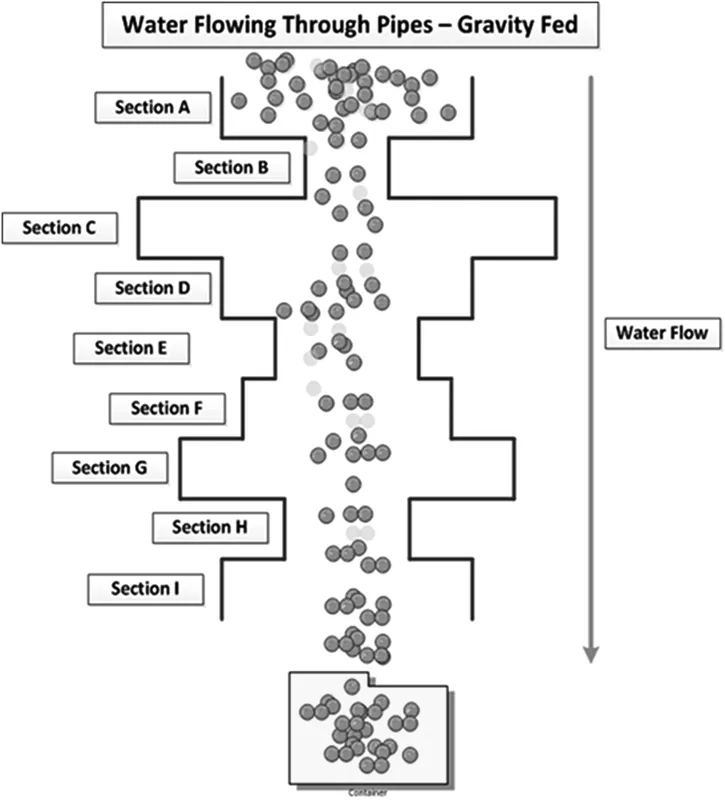
In Figure 1.2, we have now opened-up Section E’s diameter and as you can see, more water is now flowing through the system. When Section E’s diameter was increased, three distinct changes took place. First, the system constraint moved from Section E to Section B because it is now the smallest diameter pipe. Second, the throughput of water increased to the limit of the new constraint (Section B), and finally, water has now begun to accumulate in front of Section B.
FIGURE 1.2
Piping system with Section E enlarged.
Ask yourself, “Would increasing the diameter of any other section have resulted in any more throughput of water?” The answer is a resounding no! Only increasing the diameter of Section E would have resulted in more water flowing through this system. The inevitable conclusion is that the system constraint controls the system throughput and focusing improvement efforts anywhere else is typically wasted effort. Let’s now look at how this might apply to a simple manufacturing process.
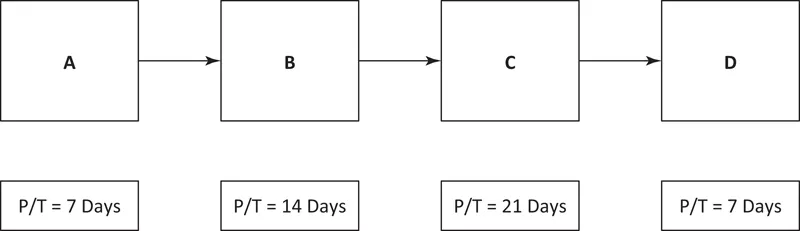
Figure 1.3 is a simple four-step diagram of a manufacturing process used to produce some kind of product. Based upon what you have learned from seeing the piping system, ask yourself which step is limiting the production of this product through this process and why it is the limiting process step. Let’s look at some different scenarios to help answer this question in more depth.
FIGURE 1.3
Basic four-step process.
The first question we should ask is, based upon the processing times of each step, how long does it take to process a single part through this process? For the first part of this process, the processing time for one part would be the sum total of each of the individual processing times as follows:
| | |
The next question to answer is, once the production line is full, what is the output rate of this simple process? The answer to this question is that because Step C, at 21 days, limits the output rate, then the rate of this process, as it currently exists, is one part every 21 days. Figure 1.4 summarizes this process with the constraint highlighted. Let’s now look at some additional scenarios that will have an impact on this manufacturing process.
FIGURE 1.4
Basic four-step process with constraint highlighted.
Suppose that Step A has problems and goes down for 7 days, what would happen to the output rate of this process? The simple answer is, nothing changes because it only takes 7 days to complete, so there are still 7 days of buffer time left over to supply Step B. Now suppose Step B goes down for 7 days. Again, nothing changes, because it only takes 14 days to complete, so it should still be able to supply Step C in time before it is starved. Finally, if Step D goes down for 7 days, throughput remains the same because it has a time buffer of 14 days due to Step C’s extended processing time. Unfortunately, if Step C goes down for 7 days, you will have lost 7 days of throughput that is lost forever! Now let’s look at how to increase the throughput of this process.
If you are able to reduce the processing time on Step A from 7 days to 4 days, what would happen to the output of the process? The simple fact is that if you reduce the processing time on Step A from 7 days to 4 days, throughput remains the same because of Step C’s longer processing time. Likewise, if you reduce the processing time on Step B from 14 days to 7 days, what happens to the output of this process? If you reduce the processing time on Step B from 14 days to 7 days, no throughput improvement will occur, again because of Step C’s longer processing time. If you reduce the processing time on Step D from 7 days to 4 days, what happens to the output of the process?
Just like the other examples, if you reduce the processing time on Step D from 7 days to 4 days, not much happens, again because of Step C’s longer processing time. So, based on all of this, what is the only way to increase the throughput of this process? The simple answer to this question is that if you want to increase the throughput of this process, you must focus all improvements on the constraint operation and reduce its processing time!
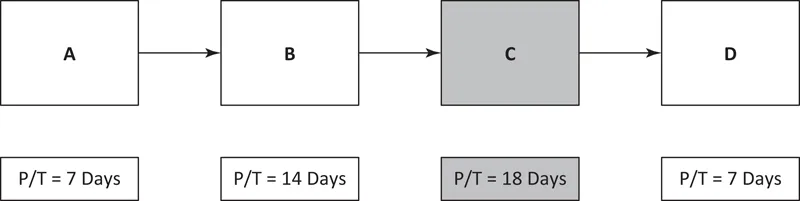
For example, what happens to the throughput of this process if you reduce the processing time in the constraint from 21 days to 18 days as in Figure 1.5? The immediate effect of this time reduction is that you improve the throughput of the process from one part every 21 Days to one part every 18 Days, or a 17-percent increase! Because of the impact of your constraining step on the output, doesn’t it make sense to focus most of your improvement efforts on the constraint? Exceptions to this would be if there are quality issues causing scrap or excessive rework with Step D or prolonged delays within Step B. This, of course, assumes that the demand for your product is high enough to be able to sell the additional product.
FIGURE 1.5
Basic four-step process with constraint time reduced.
The next, most obvious question you might ask is, how do you reduce the processing time in the constraint? The answer to this question is the essence of this book. By reducing waste (through Lean tools and techniques) and variation (through Six Sigma tools and techniques), focusing primarily on the system constraint. In other words, by doing things like off-loading work from the constraint to non-constraints, or by eliminating scrap or rework conditions in the constraint and non-c...