eBook - ePub
GGE Biplot Analysis
A Graphical Tool for Breeders, Geneticists, and Agronomists
- 288 pages
- English
- ePUB (mobile friendly)
- Available on iOS & Android
eBook - ePub
GGE Biplot Analysis
A Graphical Tool for Breeders, Geneticists, and Agronomists
About this book
Research data is expensive and precious, yet it is seldom fully utilized due to our ability of comprehension. Graphical display is desirable, if not absolutely necessary, for fully understanding large data sets with complex interconnectedness and interactions. The newly developed GGE biplot methodology is a superior approach to the graphical analys
Trusted by 375,005 students
Access to over 1.5 million titles for a fair monthly price.
Study more efficiently using our study tools.
Information
Subtopic
Probability & StatisticsSection II
GGE Biplot and Multi-Environment Trial Data Analysis
3 Theory of Biplot
SUMMARY
This chapter introduces the theory of biplot through examining the process of matrix multiplication. A rank-two matrix results from multiplying one matrix with two columns with another matrix with two rows. A biplot displays a rank-two matrix through plotting its two component matrices in a scatter diagram. A biplot not only displays the two component matrices but also the product matrix, though implicitly. The elements of the product matrix are recovered through the inner-product property of the biplot. Moreover, a biplot allows visualization of the product matrix from all perspectives. These include:
• Ranking of the rows in each column
• Ranking of the columns in each row
• Comparison of two rows for all columns
• Comparison of two columns for all rows
• Identification of the largest value (row) within each column
• Identification of the largest value (column) within each row
• Visualization of the interrelationships among rows
• Visualization of the interrelationships among columns
These form the basis for visualizing two-way datasets. If the mathematics looks complicated, one may just skip this chapter. Nevertheless, it will not hinder one’s ability to understand and apply the genotype and genotype-by-interaction (GGE) biplot methodology to one’s data.
3.1 THE CONCEPT OF BIPLOT
3.1.1 MATRIX MULTIPLICATION
Two matrices can only be multiplied if the number of columns in the first matrix located on the left side of the multiplication sign equals the number of rows in the second matrix located on the right side of the multiplication sign. The product matrix assumes the number of rows of the left matrix and the number of columns of the right matrix. Thus the left matrix may be conveniently referred to as the row matrix and the right matrix the column matrix.
Assume that we have a row matrix:
and a column matrix:
Since G has two columns and E has two rows, they can be multiplied; and since G has four rows and E has three columns, the product matrix Y will have four rows and three columns:
The rule of matrix multiplication is that an element in Y is the sum of the product between each element of a row in the row matrix (G) and each element of a column in the column matrix (E). Thus, the 4 × 3 = 12 elements in Y are calculated as follows:
Y is called a rank-two matrix, since it results from multiplication of G, which has two columns, and E, which has two rows. A rank-two matrix can be displayed by a two-dimensional biplot (Gabriel, 1971).
3.1.2 PRESENTING THE MATRIX MULTIPLICATION PROCESS IN A BIPLOT
Now, we present matrices G and E in the form of a table (Table 3.1), in which the two columns of G are named as x and y, and the two rows of E are also named x and y. Likewise, we present matrix Y in the form of a table (Table 3.2), which indicates the row and column origin of each element. For example, Y11 is summation of the product between the first row of matrix G (G1) and the first column of matrix E (E1), and Y32 is the product between the third row of matrix G (G3) and the second column of matrix E (E2), etc.
If the x values are plotted against the y values in Table 3.1, a two-dimensional scatter diagram is generated, in which each row of G is represented by a point. Similarly, each column of E is represented by a point (Figure 3.1). This scatter diagram is called a biplot because it displays both the row and column matrices. The biplot not only presents the two original matrices, G and E, but it also displays their product, matrix Y. We show how Y is displayed next.
Names | x | y |
|---|---|---|
Row matrix (G) | ||
G1 | 4 | 3 |
G2 | −3 | 3 |
G3 | 1 | −3 |
G4 | 4 | 0 |
Column matrix (E) | ||
E1 | 2 | 4 |
E2 | −3 | 1 |
E3 | 3 | −2 |
Columns | |||
|---|---|---|---|
Rows | E1 | E2 | E3 |
G1 | 20 | −9 | 6 |
G2 | 6 | 12 | −15 |
G3 | −10 | −6 | 9 |
G4 | 8 | −12 | 12 |
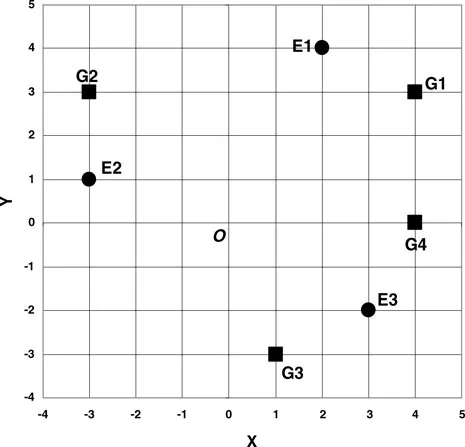
Table of contents
- Cover
- Half Title
- Title Page
- Copyright Page
- Foreword
- Preface
- Table of Contents
- SECTION I Genotype-by-Environment Interaction and Stability Analysis
- SECTION II GGE Biplot and Multi-Environment Trial Data Analysis
- SECTION III GGE Biplot Software and Applications to Other Types of Two-Way Data
- References
- Index
Frequently asked questions
Yes, you can cancel anytime from the Subscription tab in your account settings on the Perlego website. Your subscription will stay active until the end of your current billing period. Learn how to cancel your subscription
No, books cannot be downloaded as external files, such as PDFs, for use outside of Perlego. However, you can download books within the Perlego app for offline reading on mobile or tablet. Learn how to download books offline
Perlego offers two plans: Essential and Complete
- Essential is ideal for learners and professionals who enjoy exploring a wide range of subjects. Access the Essential Library with 800,000+ trusted titles and best-sellers across business, personal growth, and the humanities. Includes unlimited reading time and Standard Read Aloud voice.
- Complete: Perfect for advanced learners and researchers needing full, unrestricted access. Unlock 1.5M+ books across hundreds of subjects, including academic and specialized titles. The Complete Plan also includes advanced features like Premium Read Aloud and Research Assistant.
We are an online textbook subscription service, where you can get access to an entire online library for less than the price of a single book per month. With over 1.5 million books across 990+ topics, we’ve got you covered! Learn about our mission
Look out for the read-aloud symbol on your next book to see if you can listen to it. The read-aloud tool reads text aloud for you, highlighting the text as it is being read. You can pause it, speed it up and slow it down. Learn more about Read Aloud
Yes! You can use the Perlego app on both iOS and Android devices to read anytime, anywhere — even offline. Perfect for commutes or when you’re on the go.
Please note we cannot support devices running on iOS 13 and Android 7 or earlier. Learn more about using the app
Please note we cannot support devices running on iOS 13 and Android 7 or earlier. Learn more about using the app
Yes, you can access GGE Biplot Analysis by Weikai Yan,Manjit S. Kang in PDF and/or ePUB format, as well as other popular books in Technology & Engineering & Probability & Statistics. We have over 1.5 million books available in our catalogue for you to explore.