The Great Ice Age documents and explains the natural climatic and palaeoecologic changes that have occurred during the past 2.6 million years, outlining the emergence and global impact of our species during this period. Exploring a wide range of records of climate change, the authors demonstrate the interconnectivity of the components of the Earths climate system, show how the evidence for such change is obtained, and explain some of the problems in collecting and dating proxy climate data.
One of the most dramatic aspects of humanity's rise is that it coincided with the beginnings of major environmental changes and a mass extinction that has the pace, and maybe magnitude, of those in the far-off past that stemmed from climate, geological and occasionally extraterrestrial events. This book reveals that anthropogenic effects on the world are not merely modern matters but date back perhaps a million years or more.
eBook - ePub
The Great Ice Age
Climate Change and Life
- 288 pages
- English
- ePUB (mobile friendly)
- Available on iOS & Android
eBook - ePub
The Great Ice Age
Climate Change and Life
About this book
Trusted by 375,005 students
Access to over 1.5 million titles for a fair monthly price.
Study more efficiently using our study tools.
Information
Subtopic
Environmental ScienceIndex
Biological SciencesPART 1
CYCLES OF CLIMATIC CHANGE: EVIDENCE AND EXPLANATIONS
The Ice Age is not a single age at all, but a series of cold periods separated by times when the climate was as warm, or even much warmer than it is today. Glacial periods alternated with interglacial: but ‘Hot and Cold Ages’ does not have the same drama about it as ‘Ice Age’. It is known that even upon the greater cycles there were smaller cold-warm climatic fluctuations, described as stadials and interstadials. The historian focuses his microscope on ever finer detail, as more precise methods of analysis are invested; he discovers more, and racks the focus up yet again, which suggests further questions and so on.
It is not so long ago that the influence of ice upon our scenery was denied by many reputable observers: other explanations were in currency for the scratches on Scottish boulders, or what we would now recognise as fossil moraines, or scraped and deepened valleys. The clues that allowed recent description of the sequence of events through the Pleistocene were derived from deep-sea cores of sediment. These were obtained many miles away from the direct influence of ice, from oozes underlying quiet ocean wastes. This is where change could be cheated. A steady and unbroken rain of shells of tiny foraminiferans falling to the sea floor were different from those in the warm phases; there are also changes to the isotopes in the crystals making up the shells. I grew up with five cycles of glaciation named in the textbooks, all of which were named after tributaries of the Danube…but thanks to these new oceanic data the number of cycles is now known to have been many more. Every year, it seems that more wiggles are added to the temperature curve for the last two million years as the investigator focuses more and more clearly upon the past.
Richard Forte. 1993. The Hidden Landscape, Jonathan Cape, London.
Signposting
Much of Part 1 is a detective story, discussing the clues—proxy climate indicators—that palaeoclimatologists use to reconstruct past changes and how they attempt to explain them. Chapter 1 contrasts the Earth today with what parts of it were like when ice sheets last reached their maximum extent 18 000 years ago, and introduces some examples of how past climates can be interpreted from geological clues. Chapter 2 gives a general overview of the Earth’s climate system, and the problems faced by the climate detective in collecting evidence and ascertaining the timing of changes. As the most spectacular manifestation of global climate change was the growth and demise of ice sheets, Chapter 3 explains how they accumulate and move and introduces the astronomical pacemaker that controlled the timing of glaciations and deglaciations. Chapters 4, 5 and 6 review the array of evidence from oceanic and terrestrial realms that show that climate change occurred over a range of time scales from millions of years, through tens of thousands of years, to more rapid changes that occurred over centuries or decades. From time to time, we take short excursions into possible explanations, but as with all good detective stories the attempt to solve the crime is left to the end. Here, in Chapter 7, you will find a number of explanations for climate change, none of which adequately explains all the evidence documented in earlier chapters. The challenge of formulating an all embracing model that explains all the clues that have been amassed drives palaeoclimatologists to seek more knowledge of the past. Their work also illuminates the possible courses of future climate change, for if models can explain the past, our confidence in their ability to make predictions about future climate trends will be increased. This is the only way we can evaluate the possible consequences of the global environmental experiment that humanity is conducting.
Much of Part 1 is a detective story, discussing the clues—proxy climate indicators—that palaeoclimatologists use to reconstruct past changes and how they attempt to explain them. Chapter 1 contrasts the Earth today with what parts of it were like when ice sheets last reached their maximum extent 18 000 years ago, and introduces some examples of how past climates can be interpreted from geological clues. Chapter 2 gives a general overview of the Earth’s climate system, and the problems faced by the climate detective in collecting evidence and ascertaining the timing of changes. As the most spectacular manifestation of global climate change was the growth and demise of ice sheets, Chapter 3 explains how they accumulate and move and introduces the astronomical pacemaker that controlled the timing of glaciations and deglaciations. Chapters 4, 5 and 6 review the array of evidence from oceanic and terrestrial realms that show that climate change occurred over a range of time scales from millions of years, through tens of thousands of years, to more rapid changes that occurred over centuries or decades. From time to time, we take short excursions into possible explanations, but as with all good detective stories the attempt to solve the crime is left to the end. Here, in Chapter 7, you will find a number of explanations for climate change, none of which adequately explains all the evidence documented in earlier chapters. The challenge of formulating an all embracing model that explains all the clues that have been amassed drives palaeoclimatologists to seek more knowledge of the past. Their work also illuminates the possible courses of future climate change, for if models can explain the past, our confidence in their ability to make predictions about future climate trends will be increased. This is the only way we can evaluate the possible consequences of the global environmental experiment that humanity is conducting.
Note: The abbreviations ‘Ma’ and ‘ka’ are used in this book to refer to the dates of past events. Ma: million years ago; ka: thousand years ago.
1
THE GREAT ICE AGE
INTRODUCTION
This book examines the Earth’s history over a very short period of time—geologically speaking that is. It focuses on the climatic history since 2.6 million years ago during which time large ice sheets repeatedly advanced and retreated across significant areas of the Northern Hemisphere. Parts of Antarctica had been ice-covered for much longer (since almost 50 million years ago), but the establishment of Northern Hemisphere ice sheets heralded a major change in the Earth’s climate system. The Great Ice Age was not the first time that the Earth has been covered by extensive ice sheets: they also developed several times during the Pre-Cambrian, and during the Ordovician and Permian-Carboniferous.
We have used the nineteenth century concept of ‘The Great Ice Age’ in the title of this book to describe the period during which major glaciers and ice sheets regularly advanced and retreated across the Northern Hemisphere. This 2.6 million year time interval spans the Pleistocene and Holocene Epochs of the Quaternary Period (Figure 1.1).
If we compress Earth history into one year, with the planet forming at one minute past midnight on 1 January, then The Great Ice Age began at about 7 pm on 31 December. Why is this short period of geological time so important? Because studying it helps us understand our past and our future. It is a unique period of time in the Earth’s history for a number of reasons:
- it is the only time when both poles were/are covered by ice sheets
- it is characterised by repeated, and relatively regular, patterns of climate change over time scales ranging from hundreds of thousands (10) to less than 100 (102) years;
- these changes can be studied to a much greater degree of resolution than for any other period of geological time;
- humans evolved during this period of climatic change and occupied every continent, and virtually every type of environment, be it hot or cold, or wet or dry;
- much of our natural heritage of landforms and wildlife is a relic of the last glacial period that ended some 20 thousand years ago;
- the Great Ice Age is not over yet, so understanding the past may help us predict future climatic and ecological changes.
The last point about predictions is worth exploring a little further in the context of forecasting the weather and longer term climatic trends. Daily changes in the weather are a familiar fact of life. Likewise, we expect seasonal changes in temperature and precipitation. We have made some progress in predicting the weather, but even with the aid of super computers, our ability to make accurate forecasts only extends to a week or two ahead. This is because weather systems exhibit chaotic behaviour. In contrast, seasonal changes are triggered by latitudinal variations in solar insolation caused by the fact that the Earth’s axis of rotation is inclined with respect to its orbital plane around the sun. This is a very simple model in which there is a broadly linear relationship between radiation received by each of the Earth’s hemispheres and seasonal changes in temperature.
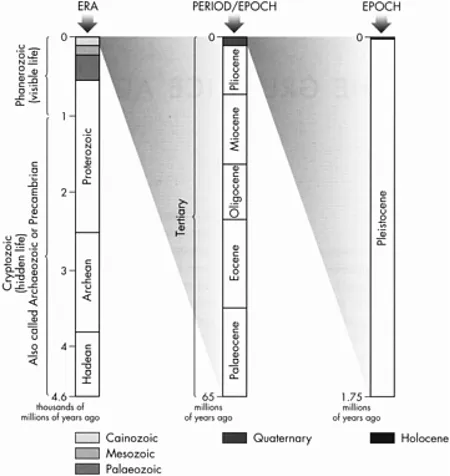
Figure 1.1 Some of the major divisions of geological time. The ‘Great Ice Age’ spans the Pleistocene and Holocene epochs; the Holocene began only 10 000 years ago.
Climate is ‘averaged weather’ (usually defined over a period of 30 years)—the average (as determined from historical meteorological measurements) temperature, pressure, wind speed and variability, precipitation and evaporation, plus seasonal variations over a given area of the Earth’s surface (Box 1.1).
Box 1.1 Climate and Life
On a totally water-covered Earth, there would be a simple latitudinal distribution of climate belts (Figure 1.2). A hot equatorial zone with heavy rainfall would straddle the equator, and be flanked by subtropical highs—areas with high evaporation and low rainfall. At higher latitudes in both hemi spheres heavy precipitation would occur where warm tropical air masses and cold polar ones would meet along the polar front along which low pressure zones would form. Low temperatures and precipitation, and high pressure, would characterise the polar regions. The presence of large con tinental areas modifies this simple pattern. This is not only because land areas have different thermal properties than oceans, but also because they significantly modify the direction of movement of atmospheric and oceanic currents.
None the less elements of the four basic climate zones—tropical, arid, temperate and polar—can be seen in any climate map of the world. More than four climate zones, however, are required to depict the full range of climate variability over the continents. The problem of depicting on maps a combination of variables such as temperature, precipitation, evaporation, wind, and their seasonal variation, is usually overcome by incorporating, to varying degrees, the distribution of biomes. Biomes are assemblages of similar ecosystems, such as tropical rain forest, desert, or temperate forest. Their distribution reflects the strong relationship between climate and life: similar environments, today and in the past, lead to the evolution of plants and animals that have similar morphologies and functions. Figure 1.3 shows the relationship between two key climatic variables (temperature and precipitation) and different biomes.
Even maps that show tropical, dry, warm temperate, cool temperate and cold climate zones have to resort to some degree to using biome distributions in order to subdivide some major zones (e.g. tropical climate is subdivided into equatorial forest, monsoon forest and savannah zones). Figure 1.4 shows the potential global distribution of biomes today: it ignores the effects of human activities (see Figure 1.21), such as agriculture and forest clearance. Elements of the simple latitudinal distribution of climatic belts can be seen on Figure 1.4, as can the effects of oceanic circulation patterns on climate.
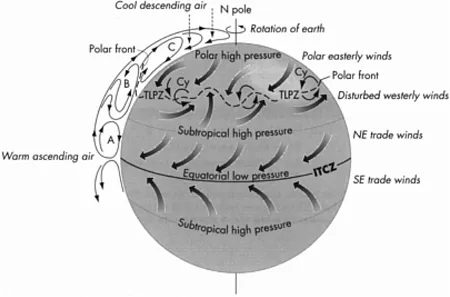
Figure 1.2Idealised planetary atmospheric circulation on a totally water covered Earth, showing three main cells (A, B, C) in the Northern Hemisphere (the same pattern is mirrored in the Southern Hemisphere). Latitudinal variation in solar heating causes convection currents which are deflected longitudinally by the effect of the Earth’s rotation (known as the Coriolis force). Key: TLPZ: temperate low pressure zone; Cy: cyclone; ITCZ: inter tropical convergence zone.
◻ Why do different types of forest grow at the same latitudes on either side of the Atlantic (e.g. in the UK and Newfoundland)?
- NW Europe is warmed by the North Atlantic Drift (a warm surface current flowing to the north-east across the northern Atlantic), so that the distribution of climatic zones and biomes is shifted significantly northwards.
Take a moment to consider, using Figures 1.3 and 1.4, what would happen to the distribution of biomes if the intensity of the North Atlantic Drift diminished, and what would happen if global mean temperatures dropped by 5°C, or rose by 1°C. As we shall see, all these changes have occurred in the past, and significantly altered the distribution of life on the Earth.
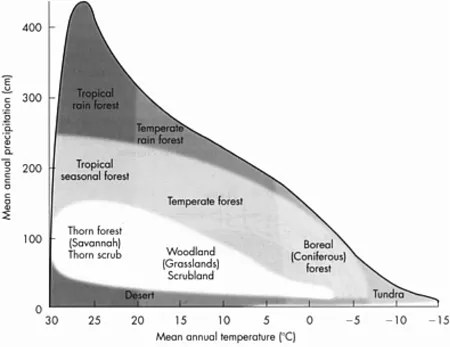
Figure 1.3 The relationship between biomes, temperature and precipitation. Note that the boundaries between different biome fields are approximate. The white area includes a wide range of environments in which either grassland or one of the biomes dominated by woody plants may form the dominant vegetation in different areas.
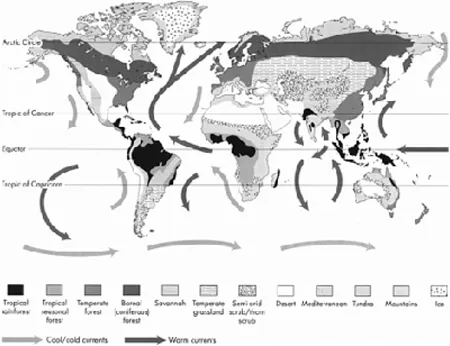
Figure 1.4 The global potential distribution of biomes. Their actual extent has been greatly modified by human activities (see Figure 1.21).
Climate variability describes differences between averages of the same kind, such as the differences between two summers in the same region. Climate change involves longer timescales—longer than that used to define the climate of an area. Palaeoclimatology is the study of major climate changes over long periods of time, based on a relatively limited data...
Table of contents
- COVER PAGE
- TITLE PAGE
- COPYRIGHT PAGE
- THE GREAT ICE AGE
- FIGURES
- BOXES
- TABLES
- PREFACE
- PART 1: CYCLES OF CLIMATIC CHANGE: EVIDENCE AND EXPLANATIONS
- PART 2: ECOLOGICAL CHANGE AND HUMAN ORIGINS
- FIGURE SOURCES
Frequently asked questions
Yes, you can cancel anytime from the Subscription tab in your account settings on the Perlego website. Your subscription will stay active until the end of your current billing period. Learn how to cancel your subscription
No, books cannot be downloaded as external files, such as PDFs, for use outside of Perlego. However, you can download books within the Perlego app for offline reading on mobile or tablet. Learn how to download books offline
Perlego offers two plans: Essential and Complete
- Essential is ideal for learners and professionals who enjoy exploring a wide range of subjects. Access the Essential Library with 800,000+ trusted titles and best-sellers across business, personal growth, and the humanities. Includes unlimited reading time and Standard Read Aloud voice.
- Complete: Perfect for advanced learners and researchers needing full, unrestricted access. Unlock 1.5M+ books across hundreds of subjects, including academic and specialized titles. The Complete Plan also includes advanced features like Premium Read Aloud and Research Assistant.
We are an online textbook subscription service, where you can get access to an entire online library for less than the price of a single book per month. With over 1.5 million books across 990+ topics, we’ve got you covered! Learn about our mission
Look out for the read-aloud symbol on your next book to see if you can listen to it. The read-aloud tool reads text aloud for you, highlighting the text as it is being read. You can pause it, speed it up and slow it down. Learn more about Read Aloud
Yes! You can use the Perlego app on both iOS and Android devices to read anytime, anywhere — even offline. Perfect for commutes or when you’re on the go.
Please note we cannot support devices running on iOS 13 and Android 7 or earlier. Learn more about using the app
Please note we cannot support devices running on iOS 13 and Android 7 or earlier. Learn more about using the app
Yes, you can access The Great Ice Age by J.A. Chapman,S.A. all at The Open University Drury,R.C.L. Wilson in PDF and/or ePUB format, as well as other popular books in Biological Sciences & Environmental Science. We have over 1.5 million books available in our catalogue for you to explore.