1.1 Introduction
Spatial planning has an important role to play in responding to the urgent need to address both the causes of climate change and the impacts of unavoidable climate change. To do so requires a reframing of spatial planning interventions, with a renewed and revised interpretation of sustainable development, which has more regard to longer time horizons, pays more attention to the relationship between new and existing built form, and has a closer focus on integrating the built envir onment with natural processes such as the carbon and water cycles, and ecosystems.
Yet there is evidence that – whether it be promoting wind farms, controlling development of areas at risk of flooding, designing energy- conserving settlements and transport, or taking account of climate change in assessment processes – this reframing of spatial planning is contentious and difficult. This book explores some of the reasons for this. It examines the different discourses of the climate change and spatial planning policy communities, the implications of the changing scale of planning concerns, and the challenge to conventional planning processes and skills. These concepts are more fully explored in Parts II and III.
In this chapter we set out our conception of spatial planning, and indicate how its scope is extending in response to the issue of climate change. But first we draw on the work of the global climate science community to outline briefly the causes and impacts of climate change, and hence the need for urgent action to address it.
1.2 Urgency of response to climate change
1.2.1 Observed changes
Evidence of climate change has been observed across the globe. These changes are seen in physical systems such as the transport of heat across the globe in oceanic circulation, in storm systems, and in polar ice seasonal accumulation and thinning. They are also seen in biological processes: such changes as earlier onset of spring events, including bud- break, bird migration and egg- laying, as well as shifts in the ranges of plants and animals both towards the poles and to higher altitudes. Both physical and biological systems have fundamental importance for the stability of life on this planet, and, through the UN Framework Convention on Climate Change, international institutions and national governments are working towards introducing measures and policies aimed at limiting the changes. Vital components of the global envir onment that underpin the natural systems have already been changed significantly (in particular, the composition of the atmosphere and the temperature of the oceans), so some ongoing changes are now unavoidable and must be managed – insofar as is possible.
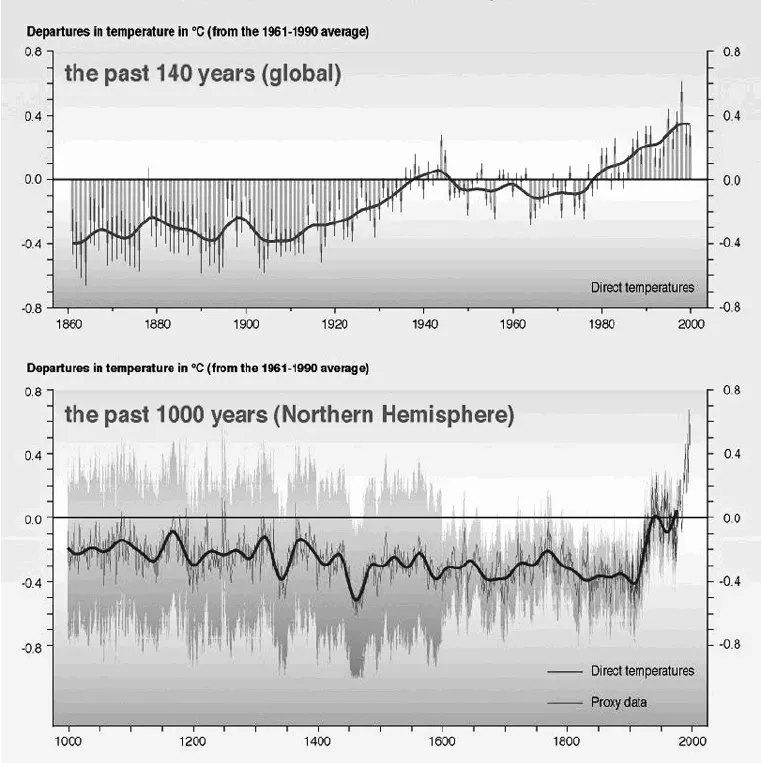
Figure 1.1 reproduces the well- known ‘hockey stick’ graph published in the Third Assessment Report of the Intergovernmental Panel on Climate Change (IPCC), which shows the extent to which the observed average annual surface temperature of the northern hemisphere has tended to vary over the past millennium (based on many data sources, as shown) in comparison with a baseline period between 1961 and 1990 (IPCC, 2001, Figure 2.3). The figure points to a warming trend quite out of proportion with previous variation over ten centuries. These changes and their implications are discussed in Chapter 2.
Across the globe different impacts will predominate. Within Europe, the regions considered to be most at risk are the mountain areas and Scandinavia, the Mediterranean region and coastal areas and densely populated flood plains
(CEC, 2009a). In north-west Europe predicted trends include warmer, wetter winters and warmer, drier summers, with increased risk from river and coastal flooding. There is accumulating evidence of these changes already occurring (see Box 1.1 for UK observations of climate change).
1.2.2 Essentials of the science of climate change
Awareness of the consequences of changing the composition of the Earth’s atmosphere has been growing in line with the measured increase in the proportion of greenhouse gases. This was demonstrated by observations by Keeling (1960, 1998), for the period from 1957, and subsequently shown to have been increasing since the beginning of the industrial period (IPCC, 2007b). Our understanding of the greenhouse effect, under which the atmosphere warms when heat is cumulatively gained and stored at an increasing rate, has its roots in the work of physical scientists including Fourier, Saussure and Tyndall. By 1996, the rise in CO2 had been shown to be ‘uniquely’ linked to the burning of fossil fuels, as reported in the historical overview of climate change science for the IPCC Fourth Assessment Report (IPCC, 2007a, p. 100). In addition, whilst early work associated the greenhouse effect principally with carbon dioxide (CO2) and water, evidence had accumulated by the 1970s that other gases – some newly synthesized by industry – were also implicated in atmospheric warming, notably methane, nitrous oxide and chlorofluorocarbons (CH4, N2O and CFCs). The role of certain other atmospheric constituents – such as sulphate aerosols – in reflecting sunlight and so, to a degree, offsetting global warming, was also identified (Reader and Boer, 1998), further developing scientific understanding of the complex reactions affecting atmospheric temperatures and contributing to climate change. Other work has attempted to identify similarities between the variations and instabilities accompanying abrupt climatic changes in the past and the current changes. So far, these comparisons have not shown up any similar episodes in the past (IPCC, 2007b, ch. 1).
Further detail on the climate system and ‘ climate forcing’ can be found in Working Group I’s report for the IPCC’s Fourth Assessment Report (IPCC, 2007a). This report identifies the key physical and biogeochemical processes in the Earth system connected with changing climate as being atmospheric composition, chemistry, the carbon cycle and feedbacks between the carbon cycle, ecosystems and atmospheric greenhouse gases (these feedbacks will affect CO2 abundance in a warmer world, see Box 1.2). The feedback processes identified include, amongst others, interaction between ice pack melt and sunlight reflection, surface warming and the release of methane from permafrost.
1.2.3 Rate of change
Long-term assessments of the atmosphere in the past – based for example on evidence from ice- cores and marine sediments – show a gradual increase in greenhouse gases until the mid- twentieth century. Raupach et al. (2007) have pointed to the increasing rate of CO2 emissions from fossil fuel burning and industrial processes; they note that since 2000 the emissions growth rate has been greater than for the highest forecast scenario of greenhouse gas emissions as published in the Special Report on Emissions Scenarios (IPCC, 2000). Earlier declining trends in energy intensity of national GDP (energy/GDP) have been reversed and population rates and GDP per capita rates have continued to rise – contributing to higher emissions. These researchers note that no geographical region is decarbonizing its energy supply, so progress towards the necessary abatement of emissions is negligible. Rapidly developing economies, especially China, lead the growth rate in emissions. In 2004, 73 per cent of global emissions growth came from developing and least- developed countries, though this group accounts for ‘only 23% of global cumulative emissions since the industrial revolution’ (Raupach et al., 2007, p. 10292).
The more rapid increase of emissions has led to fears amongst scientists and policymakers of rapidly deteriorating conditions, including the ‘runaway green-house’, with very significant impacts foreseen upon natural systems and for life on Earth. These conditions were set out in the Al Gore film An Inconvenient Truth, as well as by Lynas (2007) and Lovelock (2006).
1.2.4 Dangerous climate change
There have been attempts to identify what the ‘acceptable’ level of change is, either in terms of greenhouse gases in the atmosphere (expressed as ‘equival-ent concentration of CO2’) or expressed as temperature increase. In terms of temperature change, the 2007 UN Bali Climate Change Conference heard that a ‘tipping point’ would be reached if average global temperature increases by 2°C. In other words, change beyond that level might lead to self- perpetuating feedback loops and ever- greater uncontrolled change. Controversy remains as to what level of reduction of emissions is needed to avoid a 2°C increase. A peak concentration of 500 ppm in the atmosphere, falling back to 450 ppm, has been judged as the ‘stabilization level’ to prevent dangerous climate change (CCC, 2008, p. xiv). The IPCC Third Assessment Report (2001) identified five ‘reasons for concern’ (RFCs) resulting from climate change: risks to unique and threatened systems, risk of extreme weather events, inequalities in the distribution of impacts, aggregate impacts and risks of large- scale discontinuities (such as deglaciation of the West Antarctic or Greenland ice sheets). The relationships between the impacts of each RFC and increases in global mean temperatures were depicted in a diagram showing increases in level of risk associated with each RFC. In 2009 a group of IPCC member scientists, Smith et al., updated and republished this graph – known as the ‘burning embers graph’ – to show how risks change as global mean temperature increases (the graph does not show how risks change at different rates of warming). Smith et al. (2009) explain the motives for their assessment as being increased reasons for concern across all five RFCs. The original 2001 (Pa...