Section 1 Introduction to Geocoding and Mapping
This is a reference book for how to do Geographic Information Systems or GIS. So right away you have learned something you might not have known before reading this book—what the letters G, I, and S stand for in the acronym GIS. Of course, as with a lot of literal definitions, knowing what words the letters stand for does not really convey much new knowledge. The next question is, What do GIS techniques give us that we do not already have?
GIS is a methodological and conceptual approach that allows for the linking together of spatial data, or data that is based on a physical space, with non-spatial data, which can be thought of as any data that contains no direct reference to physical locations. For example, a survey of a representative sample of the population of a city or a nation is an example of non-spatial data. We have selected a sample (usually based on geographic location) of individuals who give us answers on survey questions which we have recorded. We can analyze the percentage of our sample that voted for a Republican presidential candidate, the percentage that take public transit to work, or the proportion that are married, single, or divorced. However, we do not know anything about where these respondents are located in the physical world, other than as a sample representing the U.S. population.
Suppose we add a question to the survey that asks each respondent to name the cross street nearest to their place of residence, including the name of the city and the zip code if we can get it. Now we can locate these respondents in geographic space—this is an example of a piece of spatial data. By including such a question, we have transformed our survey from a non-spatial data into spatial data.
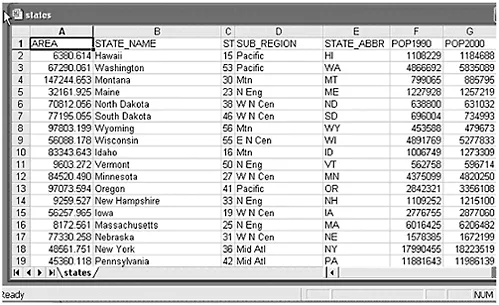
Why would we want to do this? First, once we have the ability to locate a subject in physical space, we can create maps of our survey data. Maps are often a powerful way of displaying data in an interesting and compelling way—much more so that a dry and boring table. Figure 1.1 is a display of some data for each state in the United States; among the data shown here is the membership in the U.S. Census Bureau’s sub-region classification system for each state, given in Column D.
FIGURE 1.1 A Microsoft Excel spreadsheet
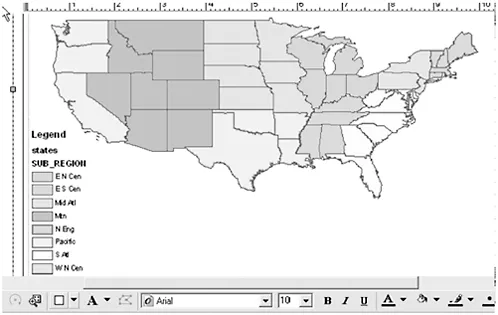
These data are spatial data because we can link the data, in this case what sub-region a state belongs to, to the physical location of the state in the United States. Displaying the same information in a map is more pleasing to the eye and better conveys the meaning of this particular piece of information, as shown in Figure 1.2.
FIGURE 1.2 Census Bureau sub-regions of the United States; a layout view from ArcMap 9.1
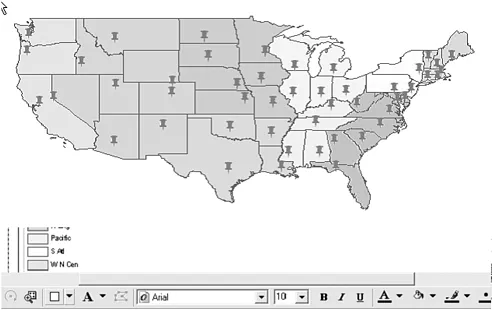
A pin map is a geographic display of the location of a type of activity, organization, or event of interest to the map maker and the map viewers. The reference to the name comes from the fact that before computerized maps, you could make one of these displays by attaching a map to a wall and then pushing pins into the map at the location of each event, organization, or activity. For example, in Figure 1.3 we have a pin map of the United States, with a pin displayed on the map at the location of the capital city of each state.
FIGURE 1.3 A pin map of the State capital cities in the continental United States
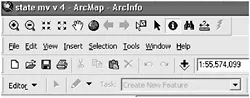
How did we know where to put the pins in Figure 1.3? The process of identifying locations to be placed on a map is called geocoding, in other words, coding the location of an object, a place, an event, a building, or an address where something of interest took place. At its most basic, something can be geocoded by knowing its latitude and longitude; for example, the capital of California, Sacramento, is located at 38.581N latitude and –121.493W longitude. However, unless you really know your longitudes and latitudes, this is not very helpful if your task is to place Sacramento in the proper location. However, with ArcGIS software (and other GIS software packages) this can be useful information for geocoding the locations of the capitals. One of the useful options in ArcMap is the option to identify an object on the map. This option can be selected by clicking on the tool bar in the upper left-hand portion of the ArcMap screen as shown in Figure 1.4.
FIGURE 1.4 The tool bars and the Identify tool
The “i” inside the dark circle is the Identify tool. Once you activate the tool you can move it around the map to various objects; clicking on the object to reveal what the program knows about that object or location.
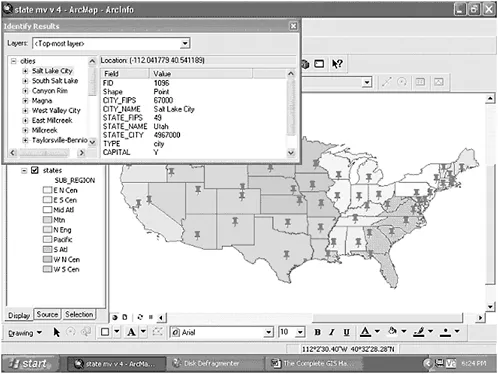
In Figure 1.5, you can see the result of clicking the object on the pin that is likely to be the capital of Utah, Salt Lake City.
FIGURE 1.5 Identifying Salt Lake City
Among the information displayed in the drop down box labeled Identify Results is the longitude and latitude of Salt Lake City. Notice also at the bottom right of the screen another latitude and longitude is displayed; if you move the cursor around on a map, this line will display for you the longitude and latitude of wherever the cursor is pointing.
Most times, however, you will not have longitude and latitude as part of a database you want to link to a map. Another very common type of information you may have access to is a street address or an intersection of two streets. This kind of information can also be used to link objects, events, and structures to a map through the process of geocoding.
Before we get into the details of how to geocode addresses, why do we want to know the address of an event of sociological, criminological, or other disciplinary significance? How can this information be useful to us? Sociology and criminology are disciplines that focus on the importance of context—as does public health and geography, and increasingly, public policy and other social sciences as well. But what does this really mean? In much of the history of these disciplines, the idea that context mattered for understanding social behavior, criminal behavior, health behavior, and so on was more platitude than a nexus for analytic understanding. Even when context really mattered, as in a theory such as Sutherland’s (1947) differential association, in which the context created by your friends was seen to influence whether or not you developed attitudes unfavorable towards the legal code and whether or not you learned how to commit illegal acts, the physical context was not treated as part of “context” at all (see Matsueda, 1982). For example, you might find that, following Sutherland’s approach, two individuals have the same number of and intensity of connections to delinquent peers, but in one case these peers all live within a block or two of the subject, while in the second case these peers are scattered all across the city. If the second subject showed fewer delinquent acts, this could be explained by the lack of concentrated access to these peers in the immediate environment. Being able to place the location of peer networks in physical proximity or not could make the difference in delinquency understandable; looking only at Sutherland’s ideas as stated would not allow you to fully understand the differences in outcomes. Being able to “bring the context back in” with geocoding of the location of people, events, organizations, facilities, and so on is an important tool that GIS can bring to social and behavioral research for increased power and understanding.
In the following example we will examine youth violence in the city of Riverside, California. In terms of policy, it is very much in the city’s interest and that of its police department to know where youth violence clusters. In such “hot spots” of crime (see Sherman and Berk, 1984) police can place extra patrols, and city officials can build neighborhood centers, increase after school programs, provide for public health nurse visits, and/or a host of other interventions that may reduce youth involvement in crime and violence. What GIS enables is the ability to “see” such patterns across a city’s neighborhoods and thus guide city and police policies about where to deploy scarce resources and city expenditures.
Example: The Process of Geocoding
Th...