![]()
1 Introduction
1.1 Background
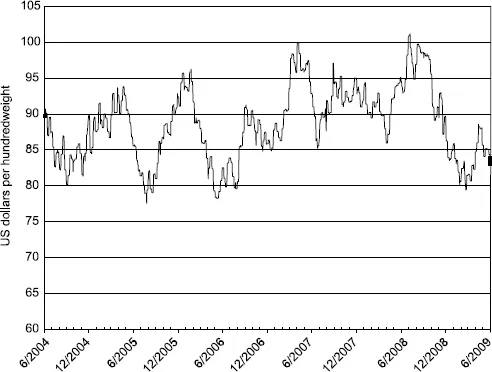
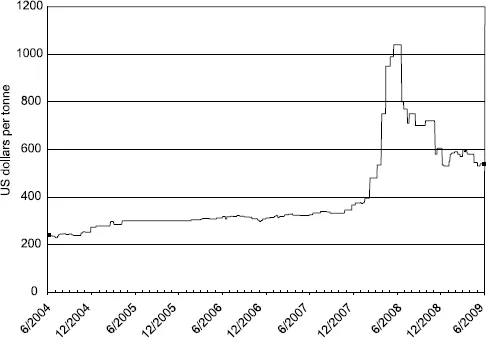
This book is about agricultural commodity prices. Commodity prices can be discussed in three dimensions: (1) long-term trends and price volatility over time; (2) pricing relationships at a particular point in time; and (3) the impact of a particular supply or demand shock on the full set of commodity prices (i.e., price integration). Figure 1.1 shows the daily spot price of live steers in the US between June 2004 and June 2009. Notice that steer prices are highly volatile, subject to repeating cycles and do not appear to be trending up or down over time. Figure 1.2 shows the daily spot price of Thai rice over the same June 2004 to June 2009 time period. In contrast to the price of live steers, the price of rice was very stable until early 2008, but then spiked to over US$1,000/tonne by the middle of 2008 and declined substantially along with most other commodity prices with the emergence of the global financial crisis in late 2008. Figure 1.2 reveals a long-term upward trend in the world price of rice.
Long-term price trends and price volatility over time are important from a public policy perspective. The world's poor and foreign aid agencies who distribute food to the poor are very vulnerable to upward trends and fluctuations in the price of stable commodities such as rice, wheat, maize and palm oil. Commodity price fluctuations also result in financial risk and planning uncertainty for farmers, food processors and other agribusiness firms. The sharp increase in prices for a wide array of agricultural commodities in 2007 and the first half of 2008 reignited the public debate regarding long-term affordability of food and the role of non-commercial speculation in agricultural commodity markets. The affordability debate has focused on the sluggish growth in global food supplies due to the on-going loss in arable farmland, climate change, a shrinking supply of fresh water for irrigation, a declining rate of productivity growth for crops and livestock and, more recently, the use of food for fuel. Critics of non-commercial speculation point out that in 2008 the number of agricultural contracts that traded on the Chicago Board of Trade rose by 20 percent to almost one million contracts, and during this same time agricultural commodity prices soared to unprecedented levels.1
Despite the public policy importance of price trends and volatility, this topic is too broad in scope to be included in this textbook. This book focuses on the equally important topics of structural pricing relationships at a particular point in time and price integration.2 Pricing relationships for a particular commodity at a particular point in time have several dimensions. The pricing relationships for the following commodity pairs highlight the different dimensions: (1) a particular type of wheat in two different regions such as France and Saudi Arabia; (2) coffee beans in a Singapore wholesale market and a futures contract for coffee on the Singapore Commodity Exchange; (3) eggs at the farm versus retail level in Australia (i.e., the so-called marketing margin); and (4) a high versus low grade of rice at a Japanese wholesale market.
Figure 1.1 Daily live steer spot price, USDA weighted average (five regions): June 2004 to June 2009.
Source: Data from Datastream International Ltd/Datastream database (computer file): USTEERS. London: Datastream International Ltd, retrieved 10 June 2009.
Price integration is a measure of the extent by which a supply or demand shock in a particular region of a particular market affects the relationship between: (1) the regional spot price and the corresponding futures price; (2) the spot prices in two different regions; and (3) the spot prices of substitute commodities. This textbook emphasizes long-run price integration, which is the change in pricing relationships after the adjustment to the new equilibrium is complete, rather than short-run integration, which is a particular path of price adjustment. As will be shown, a high degree of pricing integration is a standard feature of competitive global commodity markets.
Figure 1.2 Daily rice spot price, Thailand, long grain 100% B grade (FOB): June 2004 to June 2009.
Source: Data from Datastream International Ltd/Datastream database (computer file): RCETILG. London: Datastream International Ltd, retrieved 10 June 2009.
The predominant theme in Chapters 2 through 5 is the law-of-one-price (LOP), which results from the actions of traders seeking arbitrage profits. The LOP gives rise to a specific set of pricing relationships at a particular point in time, and also gives rise to a high degree of price integration over time. In Chapter 6 the focus is on how substitution in supply and/or demand affects the degree of pricing integration for related commodities such as corn and wheat. A high degree of substitution implies that the price response to supply and demand shocks is dampened by substitution and offsetting changes in supply and demand in other markets. In Chapter 7 substitution by consumers of differentiated products determines the level of market power for processing firms, which in turn establishes the marketing margin and the set of equilibrium prices within the food supply chain.
Chapters 8 and 9 focus on two important institutional aspects of commodity price discovery: competitive bidding and bargaining. The assumption of perfect information is maintained for the analysis of competitive bidding, but the presence of private information by participating bidders implies that the LOP no longer holds. Private information induces participating suppliers to submit seemingly random bids that balance the benefit of bidding low, which increases the probability of winning, with the benefit of bidding high, which increases the value of the supply contract when a winning bid is submitted. In Chapter 9 bargaining theory is applied to a situation involving bilateral exchange. In this case the equilibrium price of the commodity depends on the distribution of bargaining power between the two agents, and this distribution in turn depends on the comparative value of the inside and outside options for the two bargaining agents.
1.2 Specific topics
The formal analysis begins with an examination of spatial pricing relationships. These relationships are determined by the particular pattern of excess supply and demand across regions and the matrix of interregional transportation costs. The key result of this analysis is that price relationships across space can be quite unstable in the sense that a comparatively small change in supply or demand in one region can result in a very different pattern of trade and set of prices. For example, a shortage in supply in a distant importing region can change a region from being a commodity importer with a relatively high price to a commodity exporter with a relatively low price. Understanding the reason for this “domino outcome” in spatial price analysis is important from both a business management and a public policy perspective.
Intertemporal price relationships at a particular point in time refer to the relationships between the spot price of a commodity and the set of commodity futures prices. The difference between the spot price and the futures price, which is referred to as the basis, and the price spreads for commodity futures contracts with different expiry dates provide important signals to commodity producers and merchants regarding how much of the commodity to produce and how much of current stocks to store for sale in a subsequent period. For example, news of the worsening of the drought in Australia in 2007 immediately drove up the price of wheat in all of the major spot and futures markets. Price responded rapidly to this news because traders anticipated that more of the current wheat stockpile would be stored to take advantage of the higher prices that would eventually emerge, and the higher volume of storage reduced the short-term supply of wheat to the market.
Substitution is an important determinant of agricultural commodity prices. For example, when prices change, farmers substitute toward the higher-priced set of production activities, feedlots substitute toward the lower-priced set of feed grains and traders change blending practices for commodities with quality variations. In 2009 news of the rapid spread of swine flu across multiple countries caused the price of hogs to tumble and the price of cattle to strengthen in commodity futures markets. The rapid price change occurred because traders anticipated a significant global substitution of beef consumption for pork consumption. Substitution is also a central feature in the food or fuel debate. Farmers have increasingly been shifting land out of crops destined for human food and toward biofuel crops such as corn and soybeans. As well, in response to the higher price of corn and soybeans, feedlots have substituted more non-corn and non-soybean ingredients in their feed mix. The combined effect of substitution by farmers and feedlots is believed to have resulted in a significantly higher price for human food.
Agricultural economists have long worried about excessively high marketing margins because a high margin implies relatively low prices for farmers and relatively high prices for consumers. The model developed in Chapter 7 shows that high marketing margins are the result of high fixed costs and high levels of market power by commodity processors. Market power and high fixed costs normally have a positive association because processing firms achieve market power by differentiating their product, and product differentiation normally raises a firm's fixed costs. For example, marketing margins for fresh fruits and vegetables are comparatively small because of low fixed costs and a reasonably high degree of product substitution. In contrast, processed fruits and vegetables generally have high marketing margins because the products have comparatively high degrees of differentiation, and firms require high margins to cover relatively high fixed operating costs.
As discussed above, the analysis of competitive bidding and bargaining in Chapters 8 and 9 is included in this book to highlight the fact that institutional arrangements can be important for price discovery. In Chapter 8 the theory of competitive bidding is used to analyze import tenders, which are routinely used by countries when importing agricultural commodities such as rice and sugar. Import tenders are an efficient way for the importer to achieve competition amongst potential suppliers, each of whom has private information about their opportunity cost of supplying the commodity. In Chapter 9 the theory of bargaining is used to analyze bilateral exchange between a producer association with single-desk selling privileges and a monopsonistic commodity processor. Understanding the role of inside and outside options in the bargaining process is key for understanding how prices are negotiated in a bilateral exchange environment.
1.3 Motivating data
The purpose of this section is to discuss a series of graphs that highlight the various pricing relationships that have been discussed above.
Spatial relationships
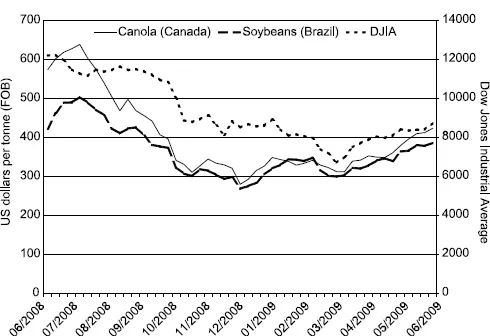
A typical spatial pricing relationship is shown in Figure 1.3. This diagram shows the price of canola in Edmonton (Canada) and the price of soybeans in Norte do Parana (Brazil) over the June 2008 to June 2009 time interval. The Dow Jones Industrial Average over this period of time is included as a pricing benchmark. On most days during the June 2008 to June 2009 period the price of canola is above the price of soybeans. This difference could be unique to this time period because of particular supply and demand conditions, or may reflect a more long-term and fundamental pricing relationship. The fundamental pricing relationship may reflect differences in transportation costs to key import markets, or may reflect differences in the value of the oil and meal that is derived from canola and soybeans.
Figure 1.3 Weekly average of Dow Jones Industrial Average, and spot prices for canola (Edmonton, Canada) and soybeans (Norte do Parana, Brazil): June 2008 to June 2009.
Source: Daily commodity data from Bloomberg L.P. (2009). Canola FOB (R) Edmonton, Alberta and Soybean FOB (R) Norte de Parana, Brazil, 1 June 2008 to 1 June 2009. Daily Dow Jones Industrial Average data from Yahoo! Finance (2010) Dow Jones Industrial, 1 June 2008 to 1 June 2009. Data retrieved 10 June 2009 from Bloomberg and 23 August 2010 from Yahoo.
Figure 1.3 reveals that the prices of Canadian canola and Brazilian soybeans are moderately integrated over time. Some of this integration is due to the fact that both prices respond to general conditions of commodity demand, which is reflected by the value of the Dow Jones Industrial Average index. More importantly, however, the prices are integrated because supply and demand shocks in the Canadian canola market are transmitted into the Brazilian soybean market and vice versa. This integration occurs because the spot prices for canola and soybeans are both derived from centralized commodity futures prices. The high degree of substitution between these two commodities implies that traders in the canola and soybean markets, who are continually searching for profitable arbitrage opportunities, can fairly rapidly shift stocks of canola and soybeans across regional markets in response to supply and demand shocks.
Figure 1.4 shows the strong correlation between the price of soft white winter wheat over the June 2008 to June 2009 time interval for two US delivery stations: Bannister, Missouri and C...