![]()
Convention Mythology
Heywood T. Sanders, PhD
SUMMARY. American cities are in the midst of a vast boom in convention center development. Communities from Hartford to San Francisco are building new or expanded centers with the goal of competing for conventions, tradeshows, and overnight visitors. That boom has been sustained by descriptions of a consistently growing demand for space, with increasing numbers of convention events and attendance, and the image of millions of dollars of local economic impact. The realities of the industry are often rather different. This article reviews the most widely employed measures of industry growth, as well as the impact of larger changes in 2001 and since. It examines the performance of major centers that have added new exhibit space in recent years and the evidence supporting forecasts of large scale economic impact and results. It concludes with an analysis of the current relationship between industry supply and demand, and the future of convention center investment. [
Article copies available for a fee from The Haworth Document Delivery Service: 1-800- HAWORTH E-mail address: <[email protected]> Website: <http://www.HaworthPress.com> © 2004 by The Haworth Press, Inc. All rights reserved.]
KEYWORDS. Convention centers, trends, economic impact, convention industry, consultants, meeting planners, headquarters hotels
American cities are in the midst of a remarkable boom in convention center development. In 1992, major U.S. exhibit halls covered about 43.4 million square feet of exhibit space. By 2002, that total had reached 57.6 million–an increase of more than 14 million square feet or 33%. And the boom is continuing. One source has estimated that another 12 million square feet will be added to the North American exhibit hall inventory over the next few years, fueled by a substantial increase in convention center construction (Tradeshow Week, 2002a). New exhibit halls are underway in Boston, Washington, Pittsburgh, Richmond, New Orleans, Chicago, San Francisco, Dallas, Houston, and Portland. The total annual government spending on convention centers grew from $1.16 billion in 1993 to an estimated $2.48 billion in 2001 and $2.43 million for 2002 (U.S. Bureau of the Census, 2002).
For city after city, new or expanded convention center space appears to be the answer to a host of local problems and concerns. Center boosters argue that these facilities, by luring long staying, big spending visitors to a community, pay their cost back multiple times in economic impact and growth. Others see the promise of filled hotel rooms and the prospect of new private investment in hotels, restaurants, and visitor services. Beyond the issue of community-wide economic development, centers also hold out the promise of downtown renewal and revitalization as visitor activity and spending brings new life into urban cores. In the words of urban planner Alexander Garvin, “Cities invest in convention centers because they think they are municipal moneymaking machines” (Garvin, 2002, p. 102).
For all the public dollars committed to convention center development, their actual impact and import have not been seriously researched and studied. The development boom has rather been sustained by a number of myths, regularly perpetuated in consultants’ feasibility and market studies and repeated from city to city by public officials and business leaders. This article seeks to review a number of those central myths and investigate the empirical evidence that supports or contradicts them. It concludes with a broader assessment of the convention industry and its future.
MYTH #1: THE PERPETUALLY GROWING INDUSTRY
For years, the convention and tradeshow industry has been described as “growing.” A September 2002 publication of the industry’s research and promotional arm, the Center for Exhibition Industry Research, argued that:
For the last 35 years continued growth of the exhibition industry has been a certainty. The question was never “Are we growing?” but rather “How much did we grow?” Even during the last four recessions the industry boasted growth in the traditional industry metrics… . Historically, the addition of new facilities has triggered additional industry growth and it is reasonable to believe that will continue to be the case in the first decade of the 21st Century. (Center for Exhibition Industry Research, 2002, p. 4)
The argument for growth–in terms of events, exhibit space, and attendance–has also been common to consultants’ feasibility studies. An analysis of the prospects for an expanded San Diego Convention Center completed by Price Waterhouse in September 1991 noted that “during the 1980s, the convention and tradeshow industry experienced increases in number of events, attendance, and required exhibit space” (Price Waterhouse, 1991, p. 3). It then estimated that the industry could anticipate a 7% increase in occupied exhibit space, and that “facilities in premier destinations have historically been able to add space and absorb it quickly (taking business from less popular destinations)” (Price Waterhouse, 1991, p. 8).
Baltimore, Maryland, got similar news from its consultant study in 1993, which concluded that “the annual growth rate in net square feet of exhibit space used averaged 7.3% between 1980 and 1991… . This indicates strong demand for larger spaces, although capacities of existing facilities act as a constraint to growth in square footage used” (Economics Research Associates, 1993, p. 11).
Optimism about industry growth has continued to the present, despite the economic travails of 2001 and the events of September 11, 2001. A February 2002 analysis for the city of Cincinnati argued that “overall, association convention and tradeshow industry trends continue to reflect general stability and new annual growth in terms of expenditures, attendance, and number of events… Within 12 to 24 months, growth in event and attendance activity is expected to resume … [and] steady event/attendance growth should continue” (Conventions, Sports and Leisure, 2002, n.p.).
The image of persistent growth is a powerful one, crucial to the promotion of ever larger convention centers. First, it implies that a growing level of demand makes it possible to fill up ever more space in new or expanded centers; that is, there is effectively little or no direct competition between centers for events or attendees. Or, as in the case of San Diego, it is argued that a “premier” destination can take convention business from less popular locales. One corollary of this part of the growth argument is that centers “lose business” because they are too small.
A second dimension of the growth argument is a new or expanded center can expect a growing business each year as new and larger events, with ever-greater attendance, come to the convention center. Based on this assumption a number of feasibility and market studies project steadily increasing activity and attendance for centers. For example, a 1988 study of a new convention center for Philadelphia argued that a survey of association executives indicated “that attendance will grow at a compound annual rate of approximately 4%,” and thus projected that the center’s 48 annual conventions and tradeshows would grow in attendance from 263,000 in 1994 to 346,000 by 2001 (Pannell Kerr Forster, 1988, p. VI-10).
Finally, market studies have regularly assumed that growth in the size of tradeshows and convention space usage obliges events to move to larger centers, outgrowing those centers that don’t expand. A 1993 feasibility study for a new Washington Convention Center by Deloitte and Touche argued that continuing growth in event space requirements meant that “markets not increasing their supply of exhibit space to meet the increased size demands of expositions could fail to attract the lucrative business of the larger events,” estimating that the average tradeshow would grow in size and attendance more than 4% each year from 1991 to 2001 (Deloitte and Touche, 1993, p. 39). The Deloitte analysis concluded that “given this growth, the Washington Convention Center will have difficulty attracting even the average-sized show in the future” (Deloitte and Touche, 1993, p. 33).
The growth argument has commonly been sustained by data from three principal sources. Meetings and Conventions magazine conducts a biennial survey of meeting planners, which provides broad information on the number of events, annual attendance, and expenditures. Tradeshow Week conducts both an annual survey of planned convention and tradeshow events, and a detailed assessment of the 200 largest events each year. Each of these sources provides a distinct, if not necessarily comparable, index to the size and change in the industry.
The “Meetings Market Survey” has long held a central place in consultant studies. Focusing on the part of that survey most relevant to convention centers, the count and size of association conventions, a November 1995 study by Stein and Company of center expansion for Austin, Texas, noted that “since 1991, conventions have experienced the most dramatic growth with a 16% increase in the number of events, a 24% increase in attendance, and a 41% increase in direct spending” (Stein and Company, 1995, Section 4, p. 15). The same language would appear the following year in a Stein and Company feasibility study for Milwaukee, Wisconsin (Stein and Company, 1996). And exactly the same language appears in a March 1997 study by C. H. Johnson (now with his own firm) of a new Boston convention center. And C. H. Johnson Consulting employed the same data, albeit not the percentage increase discussion, in a market analysis for a new center in Buffalo, New York, completed in December 1997.
Other consultants, including the former Coopers & Lybrand, have also employed the “Meetings Market Survey” results. Thus, a September 1996 analysis of public assembly facilities for the city of Fort Worth, Texas, presented tabular data on meetings and attendance, noting that “from 1993 to 1995, attendance was up 22% for conventions” and concluding that “the overall industry trends serve to highlight the stability and overall steady growth patterns of the convention and meeting industry” (Coopers & Lybrand, 1996, p. B-2, p. B-4). A similar study by Coopers the following year for Washington, D.C., concluded that “the overall long-term trend of the convention and trade show industry is one of sustained growth marked by occasional periods of lower growth in response to downswings in the nation’s economy” (Coopers & Lybrand, 1997a, p. 9).
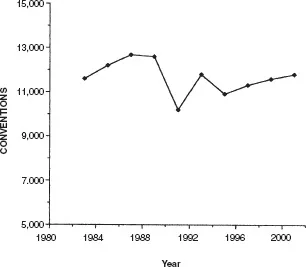
Convention attendance indexed by the survey did indeed jump 24% from 1991 to 1993, recovering from the trough of the Gulf War economic downturn. And from 1993 to 1995, there was yet another serious increase, raising the convention attendance figure to 13 million. Yet the 1995, attendance total was actually less than in 1985 and 1989. And since 1995 there has been no evidence of a consistent growth trend in either number of conventions or total attendance, as shown in Figures 1 and 2. Indeed, the count of total events for 2001 is just equal to 1993’s total and less than in the last half of the 1980s.
Despite the fact that the “Meetings Market Survey” data do not justify a conclusion of regular or predictable growth, they continue to be employed in supporting new convention centers and related hotel projects. A September 2002 study by PKF of a potential 1,500 room convention headquarters hotel for San Antonio, Texas, used the data for just 1997, 1999, and 2001 to conclude that “While the rate of growth has slowed, the increase of meeting activity over the two-year period 1999 through 2001 is a positive sign for the meetings industry” (PKF, 2002a, Sec. III, p. 6).
A second major source of industry data is the annual the Tradeshow Week Data Book. The Data Book, issued prior to the year it is dated, contains an elaborate index to convention and tradeshow events, together with information on attendance, space use, and number of exhibitors. The Center for Exhibition Industry Research has long employed the annual figures from the Data Book to make the argument of persistent growth. For example, the Center’s 1996 review of the size of exhibition industry predicted growth in the number of events to 4,781 by 2000 (or about 8.7%), with a total attendance of 140 million–a gain of 39% from the 101 million attendees estimated for 1996. A subsequent 1998 report forecast 4,970 events and 157 million attendees by 2002 (Center for Exhibition Industry Research, 1998).
FIGURE 1. Meetings Market Conventions by Year
Source: Meetings & Conventions, Meetings Market Report, selected years
But the projections of the Center failed to materialize. The Data Book counted 4,637 events in 2000, a total that fell to just 4,342 for 2002. Attendance, projected to reach 140 million for 2000, was estimated at 126 million for that year, dropping to 75 million in 2001 and just 56 million in 2002.
The total event counts from the Center for Exhibition Industry Research and the Data Book have some basis in an annual survey of exhibition organizers. They provide one estimate of the scale and direction of the industry. But as Figure 3 indicates, the recent totals for events show no real increase since the mid-1990s. The 2002 figure is almost exactly the same as in 1994 and 1995.
The Data Book’s figures for attendance are merely estimates from some event organizers produced up to a year prior to an event. Tradeshow Week does not even get estimates for all 4,000 plus events. It simply takes the average estimates–for future attendance and space use–of those who supply them, and then multiplies the averages by the event total. Essentially these constitute a multiplied set of guesses, rather than any reliable index of industry performance or activity.
The third major source of convention industry performance data is Tradeshow Week’s annual compilation of the top 200 events, the Tradeshow Week 200. The Tradeshow Week 200 is a post-hoc summary, and thus avoids the “guess” problem of the larger Data Book, although it, by definition, focuses on the largest events. If an event fails to grow sufficiently in terms...