
eBook - ePub
Nonlinear Models for Repeated Measurement Data
- 360 pages
- English
- ePUB (mobile friendly)
- Available on iOS & Android
eBook - ePub
Nonlinear Models for Repeated Measurement Data
About this book
Nonlinear measurement data arise in a wide variety of biological and biomedical applications, such as longitudinal clinical trials, studies of drug kinetics and growth, and the analysis of assay and laboratory data. Nonlinear Models for Repeated Measurement Data provides the first unified development of methods and models for data of this type, with a detailed treatment of inference for the nonlinear mixed effects and its extensions. A particular strength of the book is the inclusion of several detailed case studies from the areas of population pharmacokinetics and pharmacodynamics, immunoassay and bioassay development and the analysis of growth curves.
Trusted by 375,005 students
Access to over 1.5 million titles for a fair monthly price.
Study more efficiently using our study tools.
Information
CHAPTER 1
Introduction
Data consisting of repeated measurements taken on each of a number of individuals arise commonly in biological and biomedical applications. For example, in longitudinal clinical studies, measurements are taken on each of a number of subjects over time. Similarly, participants in pharmacokinetic experiments undergo serial blood sampling following administration of a test agent. Pharmacodynamic studies may involve repeated measurement of physiological effect in the same subject in response to differing doses of a drug. By definition, studies of growth and decay involve repeated measurements taken on sample units, which could be human or animal subjects, plants, or cultures.
Modeling data of this kind usually involves characterization of the relationship between the measured response, y, and the repeated measurement factor, or covariate, x. In many applications, the proposed systematic relationship between y and x is nonlinear in unknown parameters of interest. In some cases, the relevant nonlinear model may be derived on physical or mechanistic grounds. In other contexts, a nonlinear relationship may be used simply to provide an empirical description of the data.
The presence of repeated observations on an individual requires particular care in characterizing the random variation in the data. It is important to recognize two sources of variability explicitly: random variation among measurements within a given individual and random variation among individuals. Inferential procedures accommodate these different variance components within the framework of an appropriate hierarchical statistical model. When the postulated relationship between y and x is linear in the unknown parameters, the relevant framework is that of the classical linear mixed effects model. An alternative is provided by Bayesian inferential methods for a suitable hierarchical linear model. There is an extensive literature on hierarchical linear models; Searle, Casella, and McCulloch (1992) provide a comprehensive overview.
Methods for repeated measurement data where the relationship between y and x is nonlinear in the unknown parameters are less well developed. Treatment of existing techniques is scattered through a wide literature. The purpose of this monograph is to provide a unified presentation of methods and issues for nonlinear repeated measurement data. We begin by considering several examples to motivate our subsequent development.
1.1 Motivating examples
1.1.1 Pharmacokinetics of cefamandole
Figure 1.1 shows data from a pilot study to investigate the pharmacokinetics of cefamandole, a cephalosporin antibiotic (Aziz et al., 1978). In this experiment, a dose of 15 mg/kg body weight of cefamandole was administered by ten-minute intravenous infusion to six healthy male volunteers. Blood samples were collected from each subject at each of 14 time points post-dose. Drug concentrations in plasma were determined for each sample by high-performance liquid chromatography (HPLC). The resulting plasma concentration-time profiles for each subject are plotted in the figure.
In characterizing the pharmacokinetics of a drug, it is common to represent the body as a system of compartments and to assume that the rates of transfer between compartments follow first-order or linear kinetics. Solution of the resulting differential equations shows that the relationship between drug concentration and time may be described by a sum of exponential terms. For instance, the biexponential equation
(1.1) |
where C(t) is drug plasma concentration and t is time post-dose, follows from the assumption of a two-compartment model to describe kinetics following intravenous injection (Gibaldi and Perrier, 1982).
The data in Figure 1.1 exhibit similarly shaped profiles for each subject, with possibly different parameter values for different subjects. Variation within each subject about the model in equation (1.1) arises mainly due to the HPLC assay. It is commonly recognized that intra-subject variation of this kind tends to increase with plasma concentration level (Beal and Sheiner, 1988).
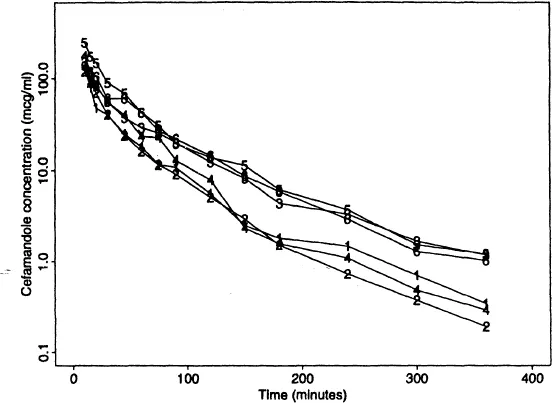
Figure 1.1 Plasma concentration-time profiles for six subjects, cefamandole data.
In pilot volunteer studies like this one, primary objectives are to establish an appropriate kinetic model, to obtain preliminary information on values of the model parameters, and to assess the nature of intra-subject variation. Typically, results from the analysis of a pilot study are used as a basis for subsequent investigation of kinetics in a larger, more heterogeneous patient population.
1.1.2 Population pharmacokinetics of quinidine
Data from a clinical study of the pharmacokinetics of the antiarrhythmic agent quinidine reported by Verme et al. (1992) consist of quinidine concentration (mg/L) measurements for 136 hospitalized patients (135 men, 1 woman) treated for either atrial fibrillation or ventricular arrhythmias with oral quinidine therapy. A total of 361 quinidine concentration measurements ranging from one to 11 observations per patient were obtained by enzyme immunoassay during the course of routine clinical treatment.
Measurements were taken within a range of 0.08 hours to 70.5 hours after dose. Table 1.1 shows partial data records for two patients selected from the total of 136. Demographic and physiological covariate information was collected for each patient over an observation period ranging from 0.13 hours to 8095.0 hours. The...
Table of contents
- Cover
- Title Page
- Copyright Page
- Dedication
- Table of Contents
- Preface
- 1 Introduction
- 2 Nonlinear regression models for individual data
- 3 Hierarchical linear models
- 4 Hierarchical nonlinear models
- 5 Inference based on individual estimates
- 6 Inference based on linearization
- 7 Nonparametric and semiparametric inference
- 8 Bayesian inference
- 9 Pharmacokinetic and pharmacodynamic analysis
- 10 Analysis of assay data
- 11 Further applications
- 12 Open problems and discussion
- References
- Author index
- Subject index
Frequently asked questions
Yes, you can cancel anytime from the Subscription tab in your account settings on the Perlego website. Your subscription will stay active until the end of your current billing period. Learn how to cancel your subscription
No, books cannot be downloaded as external files, such as PDFs, for use outside of Perlego. However, you can download books within the Perlego app for offline reading on mobile or tablet. Learn how to download books offline
Perlego offers two plans: Essential and Complete
- Essential is ideal for learners and professionals who enjoy exploring a wide range of subjects. Access the Essential Library with 800,000+ trusted titles and best-sellers across business, personal growth, and the humanities. Includes unlimited reading time and Standard Read Aloud voice.
- Complete: Perfect for advanced learners and researchers needing full, unrestricted access. Unlock 1.5M+ books across hundreds of subjects, including academic and specialized titles. The Complete Plan also includes advanced features like Premium Read Aloud and Research Assistant.
We are an online textbook subscription service, where you can get access to an entire online library for less than the price of a single book per month. With over 1.5 million books across 990+ topics, we’ve got you covered! Learn about our mission
Look out for the read-aloud symbol on your next book to see if you can listen to it. The read-aloud tool reads text aloud for you, highlighting the text as it is being read. You can pause it, speed it up and slow it down. Learn more about Read Aloud
Yes! You can use the Perlego app on both iOS and Android devices to read anytime, anywhere — even offline. Perfect for commutes or when you’re on the go.
Please note we cannot support devices running on iOS 13 and Android 7 or earlier. Learn more about using the app
Please note we cannot support devices running on iOS 13 and Android 7 or earlier. Learn more about using the app
Yes, you can access Nonlinear Models for Repeated Measurement Data by Marie Davidian,David .M Giltinan,David .M. Giltinan in PDF and/or ePUB format, as well as other popular books in Medicine & Probability & Statistics. We have over 1.5 million books available in our catalogue for you to explore.