eBook - ePub
Photoassimilate Distribution Plants and Crops Source-Sink Relationships
- 928 pages
- English
- ePUB (mobile friendly)
- Available on iOS & Android
eBook - ePub
Photoassimilate Distribution Plants and Crops Source-Sink Relationships
About this book
Adopting an interdisciplinary approach to the study of photoassimilate partitioning and source-sink relationhips, this work details the major aspects of source-sink physiology and metabolism, the integration of individual components and photoassimilate partitioning, and the whole plant source-sink relationships in 16 agriculturally important crops. The work examines in detail the components of carbon partitioning, such as ecology, photosynthesis, loading, transport and anatomy, and discusses the impact of genetic, environmental and agrotechnical factors on the parts of whole plant source-link physiology.
Trusted by 375,005 students
Access to over 1.5 million titles for a fair monthly price.
Study more efficiently using our study tools.
Information
Subtopic
Biochemistry1
Growth Analysis and Photoassimilate Partitioning
Adrie van der Werf
Research Institute for Agrobiology and Soil Fertility (AB-DLO), Wageningen, The Netherlands
I Introduction
When measured at a non-growth-limiting nitrogen supply, the relative growth rate (RGR; daily increment of biomass per unit of biomass) of species from nutrient-rich environments is generally higher than that of species from nutrient-poor environments (Grime and Hunt 1975; Poorter and Remkes 1990; Van der Werf et al. 1993a, b). Also at a growth-limiting nitrogen supply the relative growth rate of potentially fast-growing species is at least equal to and mostly higher than that of inherently slow-growing species (Bradshaw et al. 1964; Hull and Mooney 1990; Van de Vijver et al. 1993).
It is quite often thought that a high growth rate or crop productivity is associated with a high photosynthetic capacity per unit leaf area. Recently, much information has become available on respiratory processes. This aspect warrants at least equal attention, as in young vegetative plants at optimal nitrogen supply, up to 50% of the daily assimilated carbon is consumed in respiration (Poorter et al. 1990; Van der Werf et al. 1992a). Under suboptimal nitrogen conditions, this respiratory burden on the carbon budget increases substantially (Van der Werf et al. 1992a).
Not only do the primary physiological processes, i.e., photosynthesis and respiration, play a major role in the plant’s carbon budget, but so does the distribution of biomass over leaves and roots. A relatively high investment of biomass in leaves may increase the plant’s photosynthetic leaf area. On the other hand, this will generally decrease the relative amount of biomass invested ih roots, thus decreasing the capacity for nutrient uptake. The partitioning of biomass between roots and shoots has frequently been analyzed as a balance between root and shoot activity (“the functional equilibrium”; Brouwer 1966; Davidson 1969). Recently, several simulation studies have been used to explain this balance (e.g., Hilbert 1990; Hilbert et al. 1991). Section V.A. provides a hypothesis for the physiological regulation of partitioning of photoassimilates between roots and shoots as dependent on nitrogen supply.
Insight into the impact of each of these physiological and morphological characteristics on carbon gain can be gained successfully, using growth analyses (Lambers et al. 1990).
This chapter addresses the following questions:
- Which physiological and morphological characteristics determine the potential growth rate of a plant?
- What are the inherent differences in these characteristics among species from nutrient-rich and nutrient-poor environments at nonlimiting nutrient supply?
- How are these characteristics influenced by nitrogen supply and what is their integrated effect on growth?
- What is the biochemical background of several of these physiological and morphological characteristics?
A Growth Analysis
Blackman (1919) and West et al. (1920) were the first to use a mechanistic approach to analyze plant growth. Recently, Poorter (1991) provided a theoretical framework to analyze underlying mechanism of variation in relative growth rate. He also pointed out the pitfalls and caveats in plant growth analysis (Poorter and Lewis 1986; Poorter 1989). The theoretical framework provided by Poorter (1991) can be summarized as follows:
The relative growth rate (RGR; mg g−1 day−1) can be factored into the net assimilation rate (NAR; g m−2 day−1) and the leaf area ratio (LAR; m2 kg−1 [plant]):
The LAR is the product of the specific leaf area (SLA; m2 kg−1 [leaf]) and the leaf weight ratio (LWR; g [leaf] g−1 [plant]):
Generally, the NAR is considered as “the physiological component.” However, this is only partly correct as illustrated by eq. 3:
where PSa is the rate of photosynthesis per unit leaf area; LRw, SRw and RRw are the rates of respiration of leaves, stems, and roots expressed on a weight basis, respectively; SWR and RWR are the fractions of biomass in stems and roots, respectively; and CC is the carbon content of plant biomass.
Combining eqs. 1, 2, and 3 gives
Table 1 List of Abbreviations and Their Units, in Alphabetical Order
Genetic and phenotypic variation in RGR can now be explained measuring all the parameters of eqs. 1–4. Table 1 summarizes the abbreviations and the units used in this chapter.
In the following sections these inherent morphological and physiological differences at optimal nitrogen supply and at a range of suboptimal nitrogen supplies between species from nutrient-rich and nutrient-poor habitats will be discussed.
II Relative Growth Rate, Net Assimilation Rate, and Leaf Area Ratio
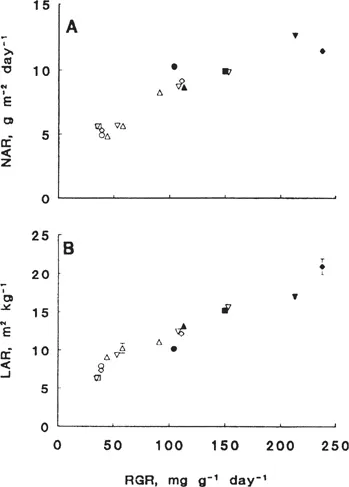
Figure 1 (A) The relation between the relative growth rate (RGR) and the net assimilation rate (NAR) at near-optimal nitrate supply (closed symbols) and several relative addition rates below near-optimal nitrate supply. (B) The relation between the relative growth rate (RGR) and the leaf area ratio (LAR) at near-optimal nitrate supply (closed symbols) and several relative addition rates below near-optimal nitrate supply. Symbols refer to the following species: Brachypodium pinnatum (□), Briza media (Δ), Carex flacca (○), Dactylis glomerata (∇), and Holcus lanatus (◊). (From Van der Werf et al. 1993b and Van der Werf [unpublished results].)
At an optimal supply of nitrogen, species from nutrient-rich environments generally have a higher RGR than species from nutrient-poor environments (Grime and Hunt 1975; Poorter and Remkes 1990; Van der Werf et al. 1993a, b). This variation in RGR is mainly explained by variation in leaf area ratio. Generally, inherently fast-growing species tend to have a higher LAR than slow-growing ones (Potter and Jones 1977; Mooney et al. 1978; Poorter and Remkes 1990; Reich et al. 1992; Fig. 1B). Only minor differences in NAR among fast- and slow-growing species are observed (Poorter and Remkes 1990; Fig. 1A). This pattern is hardly influenced by the quantum flux density at which the plants are grown. Irrespective of the quantum flux densities at which the plants are grown, variation in RGR among species is mainly explained by variation in LAR (Poorter 1991; Walters et al. 1993; Van der Werf and Enserink unpublished results).
With decreasing nitrogen supply, the RGR generally decreases (e.g., Shipley and Keddy 1988; Fichtner and Schulze 1992; Van der Werf et al. 1993b). This decrease can be attributed to a decrease in LAR and/or NAR and depends on species and the level of nitrogen supply (Garnier et al. 1989; Muller and Garnier 1990; Fichtner and Schulze 1992; Van der Werf et al. 1993b). For example, both the LAR and NAR of five grass species, differing widely in their maximum RGR, decreased at very low rates of nitrogen (Van der Werf et al. 1993b; Fig. 1A, B). On the contrary, Fichtner and Schulze (1992) found that in five out of nine species occupying habitats of different nitrogen availabilities, the decrease in RGR with decreasing nitrogen supply was mainly due to a decrease in LAR.
Surprisingly, there are only minor differences in NAR and LAR among species at suboptimal nitrogen availabilities, at least when nitrogen is supplied at suboptimal exponential addition rates of nitrate (Fig. 1A, B). Applying nitrate in this way allows a direct comparison of inherent differences in physiological and morphological plant traits, without any interference of differences between the species’ ability to take up nutrients (Van der Werf et al. 1993b).
Summarizing, at (near-) optimal nitrogen supply, differences in potential RGR are mainly explained by differences in LAR. At low rates of nitrogen supply a reduction in NAR and/or LAR contributes to a reduction in RGR.
Next, variation in morphological and physiological components underlying variation in NAR and LAR will be discussed.
III Photosynthesis
At (near-) optimal nitrogen supply, there are only minor differences in the rate of photosynthesis per unit leaf area, measured at the growth irradiance and at the whole plant level, between fast- and slow-growing species (Poorter et al. 1990; Boot et al. 1992; Van der Werf et al. 1993c; Fig. 2). Also the light-saturated rate of photosynthesis per unit leaf area is rather similar for fast- and slow-growing species (Pons et al. 1994). Even when nitrogen is supplied at such a rate that the RGR of the fast-growing species equals that of the slow-growing ones grown at optimal nitrogen supply, no differences in the rate of photosynthesis per unit leaf area are found (Fig. 2). Thus, as long as species of similar life-form are compared, only minor differences in the rate of photosynthesis per unit leaf area are found at any supply rate of nitrate (Fig. 2). At (near-) optimal nitrate supply, the rate of photosynthesis per unit leaf area therefore does not explain the large variation in RGR among these species. This conclusion holds irrespective of the light intensity at which the plants are grown. Also when species of similar life-form are compared at relatively high quantum flux densities, differences in RGR persist and only minor differences in the rate of photosynthesis per unit leaf area are observed (H. Poorter and J. R. Evans unpublished results; but see Walters et al. 1993).
When plants are grown at nonsaturating light intensities for growth and at optimal nitrogen supply, they generally overinvest in ribulose-l, 5-bisphosphate carboxylase-oxygenase (Rubisco; Stitt and Schulze 1994). A decrease in nitrogen supply leads to a decrease in Rubisco content and an increase in the activation state of Rubisco (Evans 1983; Pons et al. 1994; Van der Werf unpublished results). This explains why the rate of photosynthesis per unit leaf area or leaf weight remains constant over a wide range of rates of nitrogen supply, at least when plants are grown at nonsaturating light intensities for photosynthesis. For example, decreasing the rate of nitrogen supply for the fast-growing Holcus lanatus in such a way that the relative growth rate decreased by approximately 55% has no effect on the rate of photosynthesis (Fig. 2). This example also shows that photosynthesis per unit leaf area is poorly correlated with growth. The decrease in RGR is in this case mainly due to a decrease in leaf weight ratio (LWR). Transformed tobacco plants with antisense to the gene encoding for the small subunit of Rubisco show a wide range of Rubisco contents. Tobacco antisense plants grown at low nitrogen availability showed an approximate twofold difference in the rate of photosynthesis per unit leaf area, but hardly any difference in RGR. Similarly, antisense plants grown at high N-supply show a slight decrease in RGR (30%), whereas the rate of photosynthesis is reduced to approximately 70% (Fichtner et al. 1993). Both situations illustrate that even though photosynthesis might exert some effect on plant growth, compensatory processes such as a more efficient investment in leaf area are equally important in regulating and explaining plant growth.
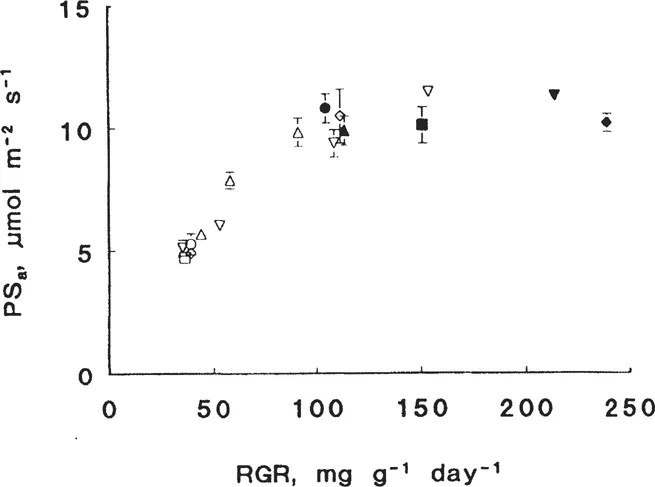
Figure 2 The relation between the relative growth rate (RGR) and the rate of photosynthesis per unit leaf area, measured at the whole plant level (PSa) at near-optimal nitrate supply (closed symbols) and several relative addition rates below near-optimal nitrate supply. Symbols refer to the following species: Brachypodium pinnatum (□), Briza media (Δ), Carex flacca (○), Dactylis glomerata (∇), and Holcus lanatus (◊). (From Van der Werf et al. 1993c and Van der Werf [unpublished results].)
Stitt and Schulze (1994) clearly point out that comparisons between species do not necessarily provide information about the relation of RGR to rate of photosynthesis, as it is not possible to decide whether different sink activities result from different rates of photosynthesis or vice versa. Thus, even though growth analysis provides a powerful tool for examining plant characteristics under similar conditions, it is not possible to decide whether these characteristics are causal or merely a consequence of other plant traits.
A Photosynthetic Nitrogen Use Efficiency
Generally, fast-growing species have a lower nitrogen content and equal rate of photosynthesis, both expressed per unit leaf area, than slow-growing species and hence have a higher efficiency of photosynthesis per unit leaf nitrogen (PNUE, μmol CO2 mol−1 Ns−1; Boot et al. 1992; Poorter et al. 1990; Fig. 3). The higher PNUE of the fast-growing species at optimal nitrogen supply is explained by two characteristics: (1) they invest less N in nonphotosynthetic components and (2) they exhibit a higher activation state of Rubisco and relatively higher activity of thylakoid reactions compared to their capacity (Pons et al. 1994). Thus, under the growth conditions used for the species presented in Fig. 3, the slow-growing species have a higher absolute amount of N invested in Rubisco, the carbon reduction cycle, the electron transport chain, and the light harvesting complex, which is actually not engaged. Upon a decrease in nitrogen supply, both fast- and slow-growing species respond with an increase in the utilization of the photosynthetic capacity and a decrease in absolute amounts of nonphotosyn-thetic N, leading to an increased PNUE (Pons et al. 1994).
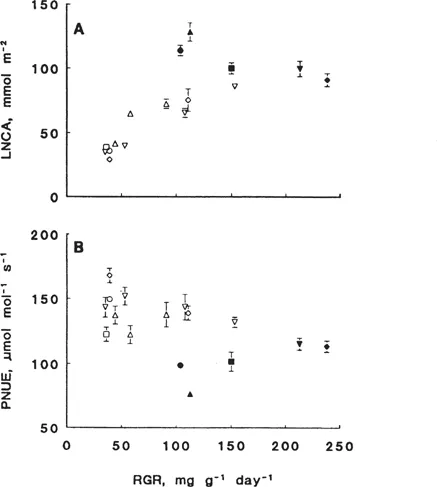
Figure 3 (A) The relation between the relative growth rate (RGR) and the organic nitrogen content per unit leaf area (LNCA) at near-optimal nitrate supply (closed symbols) and several relative add...
Table of contents
- Cover Page
- Half title
- Title Page
- Copyright Page
- Preface
- Contents
- Contributors
- Part I Physiological and Metabolic Aspects of The Components of Source-Sink Relationships
- Part II The Integration of Source-Sink Components
- Part III Whole Plant Source-Sink Relationships of Selected Crops
- Organism Index
- Subject lndex
Frequently asked questions
Yes, you can cancel anytime from the Subscription tab in your account settings on the Perlego website. Your subscription will stay active until the end of your current billing period. Learn how to cancel your subscription
No, books cannot be downloaded as external files, such as PDFs, for use outside of Perlego. However, you can download books within the Perlego app for offline reading on mobile or tablet. Learn how to download books offline
Perlego offers two plans: Essential and Complete
- Essential is ideal for learners and professionals who enjoy exploring a wide range of subjects. Access the Essential Library with 800,000+ trusted titles and best-sellers across business, personal growth, and the humanities. Includes unlimited reading time and Standard Read Aloud voice.
- Complete: Perfect for advanced learners and researchers needing full, unrestricted access. Unlock 1.5M+ books across hundreds of subjects, including academic and specialized titles. The Complete Plan also includes advanced features like Premium Read Aloud and Research Assistant.
We are an online textbook subscription service, where you can get access to an entire online library for less than the price of a single book per month. With over 1.5 million books across 990+ topics, we’ve got you covered! Learn about our mission
Look out for the read-aloud symbol on your next book to see if you can listen to it. The read-aloud tool reads text aloud for you, highlighting the text as it is being read. You can pause it, speed it up and slow it down. Learn more about Read Aloud
Yes! You can use the Perlego app on both iOS and Android devices to read anytime, anywhere — even offline. Perfect for commutes or when you’re on the go.
Please note we cannot support devices running on iOS 13 and Android 7 or earlier. Learn more about using the app
Please note we cannot support devices running on iOS 13 and Android 7 or earlier. Learn more about using the app
Yes, you can access Photoassimilate Distribution Plants and Crops Source-Sink Relationships by Eli Zamski,Arthur A. Schaffer,Zamski in PDF and/or ePUB format, as well as other popular books in Technology & Engineering & Biochemistry. We have over 1.5 million books available in our catalogue for you to explore.