![]()
Part 1
Seeing:
A Framework for Mapping
![]()
Chapter 1
Mapping a Structure
Mapping is the creative act of visually representing information based on one's experiences, impressions, and discoveries. A cartographer selects certain information that he or she wants to communicate, and translates it into a universal visual language. In addition to physical, social, and cultural spaces, maps can represent nonspatial information. They can communicate static information that remains fixed, such as the structure, size, and texture of building materials, or dynamic information that changes, such as physical movement, temperature, and lighting.
Mapping starts with an inquiry that will direct the selection (prioritization) of information to map. Information is then collected through observation, interviews, or experimentation. Finally, the information is interpreted and displayed visually. Various visual media can be used for inventive mappings, including diagrams, photography, and even movies. This representation is less reproduction than inventive reconstruction of information to make new understandings possible.
To illustrate, let's map a cup on a table. “Cup” as a noun indicates the object, but it does not describe the coldness, hardness, or weight of the cup, which can only be perceived and experienced. You could focus your research on the surface texture of the cup. You could collect information that measures roughness comparatively by collecting rougher and smoother objects. This information could be visualized as a list of objects in order of roughness, with the cup inserted in the appropriate place on the roughness scale. Color is another aspect of the cup that could be mapped. The cup may be white, but how can the nature of the whiteness be described? Perhaps it could be expressed in relation to other colors or perhaps in terms of its age. Weighing the cup may show that it is 200 grams, but the number 200 does not in itself express how the weight feels. Can you devise your own way of visualizing, or mapping, the weight of the cup?
Mapping extends the line of vision and provides new insights about previously unseen or unnoticed aspects of an object. Such exploration of multiple viewpoints is essential in discovering solutions to design problems. In the words of landscape architect James Corner, “Mapping may generate new practices of creativity, practices that are expressed not in the invention of novel form but in the productive reformulation of what is already given. By showing the world in new ways, unexpected solutions and effects may emerge.”1
Exercise: Silo
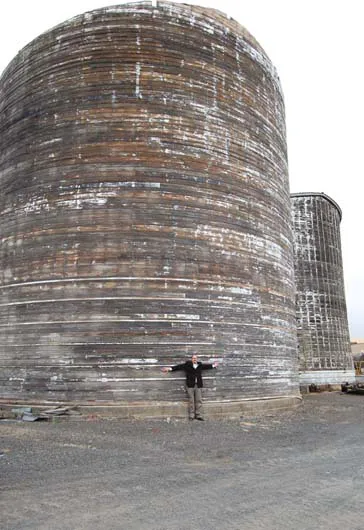
First, decide on a structure to investigate. At Washington State University, a timber silo in Colton, Washington was selected for the mapping exercise (Figures 1.1–1.3). The silo was built in the 1950s to store wheat, but its use was discontinued in the 1990s. It is 45 feet in diameter and 60 feet high. It no longer has a roof but is otherwise intact. The guidelines for mapping presented here are based on the silo but can be used for any structure.
Document the silo using conventional methods, such as model making, architectural drawings, and sketching. Then spend time exploring the silo and asking yourself what is interesting about it and why. You can study the silo based on structural systems, function, materials, or surrounding environmental conditions. In addition, you can observe the silo in order to contemplate elements that affect the atmosphere of the silo, such as sunlight, wind, color, smell, and texture. Viewing the silo at various times and from various distances can also be helpful.
Based on your findings, select an aspect of the silo to research further. After additional research and data collection, examine and experiment with various methods and media to visually represent the information in innovative ways.
Figure 1.1
Exterior of the silo, Colton, WA.
Photo: Taiji Miyasaka
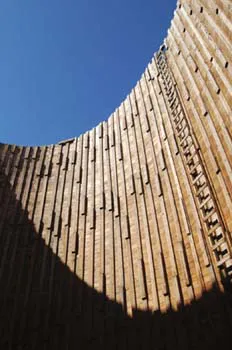
Figure 1.2
Upward view from the silo floor.
Photo: Taiji Miyasaka
This mapping exercise will challenge your frame of reference for Seeing. The level of innovation of the map is based on how you see and how you choose to visually represent whatis seen. In the sections that follow, quantitative information and perception are used as focal points for seeing, selecting, and collecting information in the mapping process. Then figure/ground reversal and photography are presented as possible ways of visually representing the information. After highlighting exemplary mapping work by students in the author's studios and seminars at Washington State University, case studies are examined to learn how skills acquired through mapping based on quantitative information, perception, figure/ground reversal, and photography can be used to address architecture and art.
Quantitative Information
Quantitative information is abstract data that is analyzed and mapped through various idioms, such as words, numbers, and images. Because information in architecture is becoming increasingly complex and dynamic, it is essential for architects to use several layers of quantitative information – clearly organized and visualized – to examine their projects. It is crucial not only to find interesting quantitative information but also to discover effective means of analyzing the information objectively and mapping it. Edward Tufte clearly expressed the importance of this approach: “Clarity and excellence in thinking is very much like clarity and excellence in the display of data.”2
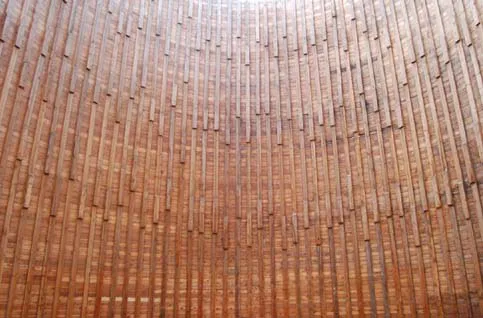
Figure 1.3
Interior of the silo.
Photo: Taiji Miyasaka
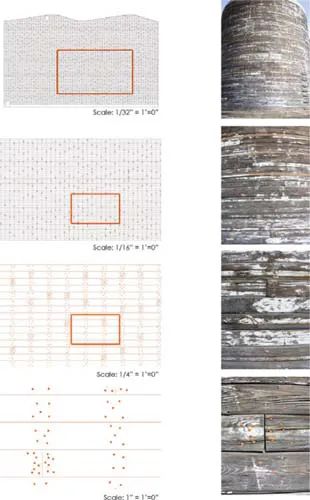
Figure 1.4
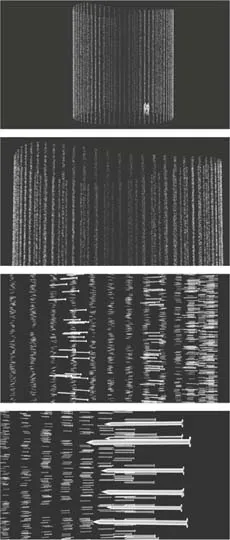
Mackenzie King and Kim Petty, Nail Quantity Map. Diagram of nail patterns in the silo. At a distance, the nails appear to follow a vertical pattern along the interior supporting structure. Zooming in reveals the unique clustering pattern.
Figure 1.5
Stephen Foster. 3D computer rendering showing locations of nails.
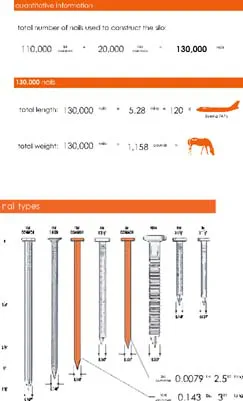
In the silo exercise, the students focused on looking for simple and clear ways to map the data. For Nail Quantity Map (2010), Mackenzie King and Kim Petty estimated that 130,000 nails were used in building the silo to hold together the three layers of 1-foot by 6-foot boards wrapping the 2-foot by 6-foot wood columns. The students focused on mapping the locations, types, and number of nails (Figure 1.4). The location of the nails was represented in a computer rendering that illustrates only nails, and none of the silo's other materials (Figure 1.5). The students portrayed the length and weight of the nails compared to that of other objects, such as a horse and an airplane (Figure 1.6).
Figure 1.6
Mackenzie King and Kim Petty, Nail Quantity Map. Comparative diagram of nail length and weight.
Figure 1.7
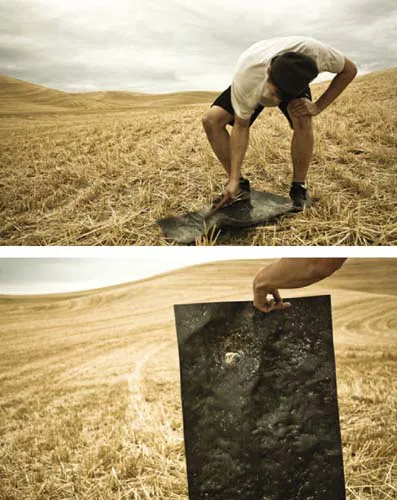
Bradly Gunn, Energy Equivalents of Pounding 130,000 Nails. Traces of pounding on a steel plate.
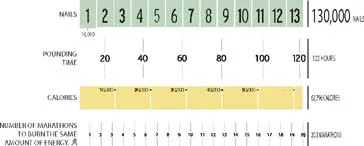
In Energy Equivalents of Pounding 130,000 Nails (2010), Bradly Gunn mapped the amount of energy required to pound the 130,000 nails. He pounded a steel plate 130,000 times so that the deformed steel would physically show the required energy (Figure 1.7). He also created a diagram representing the energy using comparative data (Figure 1.8). For example,
Figure 1.8
Bradly Gunn, Energy Equivalents of Pounding 130,000 Nails. Comparative diagram of energy used in p...