This monograph is the written version of a series of talks delivered as recent MacEachran Lectures at the University of Alberta. The informal style of the lectures, and the inclusion of a relatively large number of figures, has been preserved in order to keep the monograph faithful to the concept of an individual attempting to integrate his own research into a reasonably coherent framework. Although the volume is very much a personal account of one individual's perspective, the studies reported are naturally a product of many collaborations as well as inspirations from colleagues. The fundamental issue addressed is how adult age differences in fluid or process aspects of cognitive functioning are to be explained. Several potential mediators are considered, with most of the emphasis devoted to the investigation of working memory and processing speed as variables mediating relations between age and cognition.
- 152 pages
- English
- ePUB (mobile friendly)
- Available on iOS & Android
eBook - ePub
Mechanisms of Age-cognition Relations in Adulthood
About this book
Trusted by 375,005 students
Access to over 1.5 million titles for a fair monthly price.
Study more efficiently using our study tools.
Information
Subtopic
Developmental PsychologyIndex
PsychologyChapter 1
The Phenomenon and the Methods to be used in its Investigation
I begin by describing two important restrictions on the material covered in this monograph. The first is that I refer only to my own research. This does not mean that I am unaware of, or unappreciative of, the important contributions of others. I firmly believe that progress in science is accomplished because of the combined efforts of a great many people, and thus a personal perspective inevitably provides a distorted portrayal of the total knowledge in a field, and of how that knowledge was achieved. Nevertheless, it is sometimes interesting to examine an individual researcher’s approach to a problem, and it is certainly easier for that individual to describe his or her own research than also to attempt to review and integrate the research of others. Moreover, this type of egocentric perspective may be defensible when, as in the present case, almost all of the research to be discussed has been described in journal articles where the relevant research of other investigators has been cited.
The second restriction on the scope of the discussion is that it is limited to what is known as fluid or process aspects of cognition. That is, the focus is on the efficiency or effectiveness of processing at the time of evaluation, and not on the accumulated products of prior processing or inventories of one’s knowledge. The emphasis is therefore on what Horn and Cattell (1967) refer to as fluid intelligence, rather than what they term crystallized intelligence, and on measures like those in the WAIS-R (Wechsler, 1981) Performance scale instead of those in the WAIS-R Verbal scale. The reason for this restriction is very pragmatic—these are the measures that have been found to have the largest relations with age, and consequently are the most in need of explanation.
The major issue to be addressed in this monograph is represented in Figure 1.1, and can be succinctly expressed in the form of the following question: What is responsible for the relations between age and measures of cognitive functioning? More specifically, the purpose of this monograph is to describe the research I have conducted in which I have attempted to replace the question mark with detailed mechanisms.
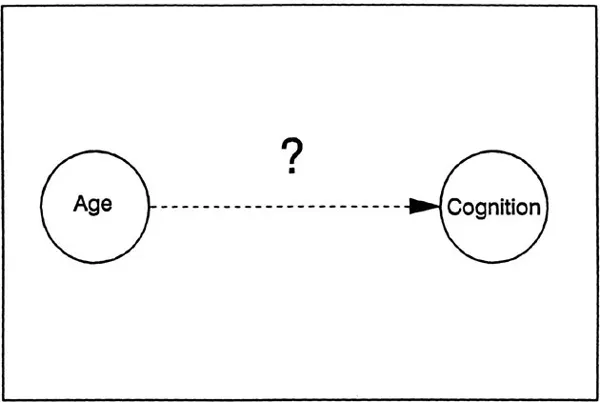
Figure 1.1 The fundamental issue addressed in this monograph: What is responsible for the relations between age and cognition?
The Age-Cognition Phenomenon
An important initial step is to describe the phenomenon to be explained. The research participants in the projects I discuss were primarily middle class adults, with moderately high levels of education (typically averaging between 14 and 15 years of formal education), who generally reported themselves to be in good to excellent health. In most of the projects I have tried to obtain nearly the same number of males and females, and the age range of the participants usually has been between about 18 and 80 years of age. These characteristics mean that I am not dealing with the very old, or with Iam concerned witn normal aging across a wide range 01 aauitnoou, and not extreme old age or pathological aging. Most research participants were recruited from newspaper advertisements, community organizations, and referrals from other participants. Some of the projects involved two extreme groups, in which case the young adults typically were students (almost always between 18 and 25 years of age), and the older adults were volunteers from the community (usually between 55 and 80 years of age).
A wide range of tests or tasks were used to assess cognitive functioning in these projects. (The terms tests and tasks are used interchangeably in this monograph.) Three typical tests are illustrated in Figure 1.2. An example of a test used to measure reasoning abilities is the Raven’s Advanced Progressive Matrices. As can be seen in the top panel of Figure 1.2, items in this test consist of a matrix of geometric patterns in eight cells of a 3 × 3 matrix. The requirement for the examinee is to select the best completion for the missing cell in the matrix from a set of eight alternative patterns.
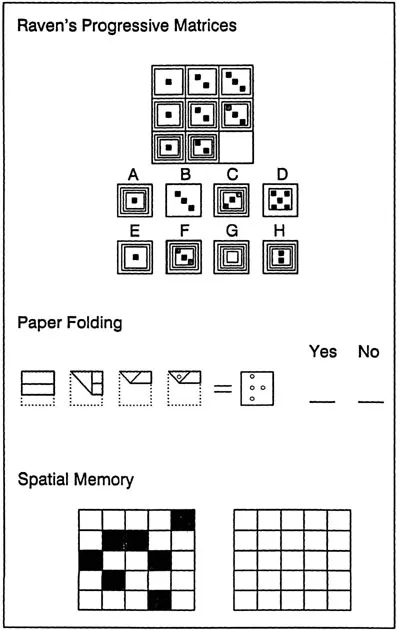
Figure 1.2 Examples of items in three cognitive tests assessing reasoning ability, spatial ability, and memory ability.
The Paper Folding Test is an example of the type of test used to measure spatial abilities. The examinee in this test is to inspect a series of rectangles representing the folding of a piece of paper and the punching of a hole through the folded paper, and then to determine whether the displayed pattern of holes would result from that sequence of folds and punch location.
One test used to assess memory abilities is the Spatial Matrix Memory Test. The to-be-remembered material in this test consists of the locations of seven targets in a 5 x 5 matrix, and recall is evaluated in terms of the number of targets reproduced in their correct positions in a blank matrix.
Comparison of results across such different kinds tests is complicated when the measures are not in the same scale, and only indirect contrasts may be possible when the tests have different units of measurement. Moreover, direct comparisons are not always meaningful even when all the variables are reported in the same units. As an example, two tests might both be measured in terms of the percentage of responses answered correctly, but the measures may not be equivalent because the tasks might vary in the difficulty of the discriminations, or in the accuracy rates attributable to chance (e.g., 12.5% for the Raven’s Progressive Matrices Test, and 50% for the Paper Folding Test).
One method of avoiding the problem of disparate performanc measures is to convert the performance measures into standard devu tion units of young adults. This transformation leads to all measure having the same meaning because the new measurement scale refer to the relative position of the score in a reference distribution. That i; all scores can be interpreted in terms of the percentage of scores in th reference distribution above or below that value. Any of seven different groups could be used as the reference group, but definin young adults as the reference group may provide the most sensitiv evaluation of the age relations. Another possibility is to use th distribution from the entire sample as the reference group. The disad vantage of this procedure, however, is that the age relations will likel be underestimated because the standard deviation from the entir sample includes between-age as well as within-age variation.
Just as there are many ways to represent cognitive performance there are also many ways to represent relations between age an performance. Aparticularly informative method consists of portrayin the distribution of scores from the entire sample, and then the distribu tions for each successive decade. If age is systematically associate with level of performance, then one would expect a differentiation c the distributions according to age.
Distributions of scores in the total sample, and in each decade, fc the three tests described earlier are illustrated in the next three figure; Figure 1.3 represents the data from 221 adults with the Raven Advanced Progressive Matrices Test (Salthouse, 1991a, Study 1’ Figure 1.4 represents the data from 383 adults on the Paper Foldin Test (Salthouse … Mitchell, 1990), and Figure 1.5 represents the dat from 362 adults on the Spatial Memory Test (Salthouse, Kausler, I Saults, 1988). The age relations in each figure are evident both in th gradual shift of the distributions toward lower scores with increase age, and in the progressively lower means (indicated by the arrows at successive decades. These figures clearly indicate that the overa distribution can be decomposed into separate distributions distin guished by the age of the individual.
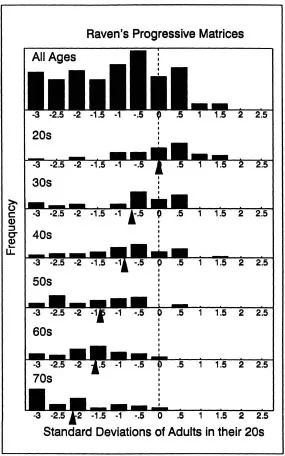
Figure 1.3 Distribution of Raven’s Progressive Matrices scores, in young adult standard deviation units, across all ages and at each age decade. Data from Salthouse (1991a, Study 1).
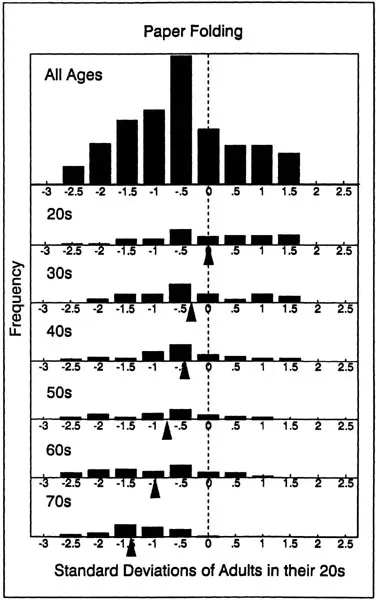
Figure 1.4 Distribution of Paper Folding scores, in young adult standard deviation units, across all ages and at each age decade. Data from Salthouse and Mitchell (1990).
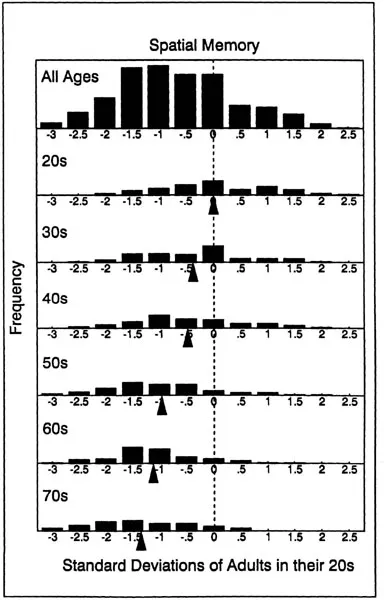
Figure 1.5 Distribution of Spatial Matrix Memory scores, in young adult standard deviation units, across all ages and at each age decade. Data from Salthouse, Kausler, and Saults (1988).
Partitioning of the variance in the total distribution can be quantifie in terms of the proportion of variance, or R2, associated with age in regression equation predicting the measure of cognitive performancf The R2 for the three measures represented in Figures 1.3, 1.4, and 1.5 and for five additional measures, are portrayed in Figure 1.6. The Ven diagrams in the left of the figure illustrate that the RL values can be interpreted as representing the degree of overlap of the circle representing the age variance with the circle representing the cognition variance.
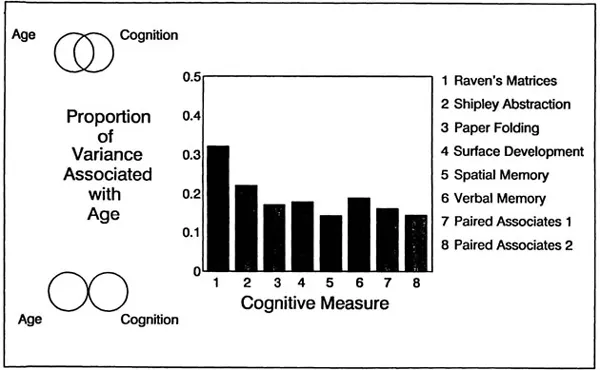
Figure 1.6 Illustration of R2 associated with age in regression equations predicting cognitive performance. Data set s 1 and 2 from Salthouse (1991a, Study I), Sets 3 and4 from Salthouse and Mitchell (1990), Sets 5, 6, and 7 from Salthouse, Kausler, and Saults (1988), andset 8 from Salthouse (in preparation).
The results in this figure are fairly typical because R values of between about .1 and .3 have been reported across a wide range of cognitive variables. The absolute proportion of the total variance in cognitive measures systematically related to age is rather small, but it is almost always significantly greater than zero, and is larger than most other single-variable influences on behavior. In support of this last point is Cohen’s (1988) observation that correlations in the behavioral sciences are small if r = .1, medium if r = .3, and large if r = .5. Most of the relations represented in this figure, which correspond to the square of the correlation, therefore would be considered medium to large in the context of behavioral research.
The R values derived from linear regression equations may underestimate the true magnitude of the association between age and measures of cognition if some of the relations are nonlinear. Although nonlinear trends are sometimes reported in data of this type, few quadratic or cubic trends were statistically significant in analyses of the data I describe, and even when significant they invariably were associated with very small increments in variance relative to the variance associated with the linear relation. It therefore seems reasonable to consider the relations between age and cognition as primarily linear in nature.
The same general pattern of a systematic association between adult age and cognitive performance has been reported in many different variables, including, but not restricted to, those assessing reasoning, spatial, and memory abilities. This pattern of negative relations between age and performance in a variety of cognitive assessments is the phenomenon addressed in this monograph.
Importance of the Phenomenon
There are several reasons to believe that age-cognition relations of the type just described could be important outside the research laboratory. One reason is that performance on similar cognitive measures has been found to be related to occupational level as well as to age. Both of these relations are apparent in Figure 1.7, which illustrates two analyses of the data from the WAIS-R standardization sample (data from Kaufman, 1990, and Wechsler, 1981). Of particular interest are the results with the Performance IQ measures because the tests comprising that scale are most similar to the fluid or process type of cognition of primary concern here. Notice that average Performance IQ differs by about 20 points from the highest to the lowest occupational level among adults between 20 and 54 years of age. This indicates that incumbents in occupations varying in status or prestige have substantially different average levels of cognitive performance. However, the figure additionally reveals that the difference in average performance between age 20 and age 70 on these same measures is nearly 30 points. The age-related variation with these measures of cognitive functioning is therefore greater than that found across major occupational categories.
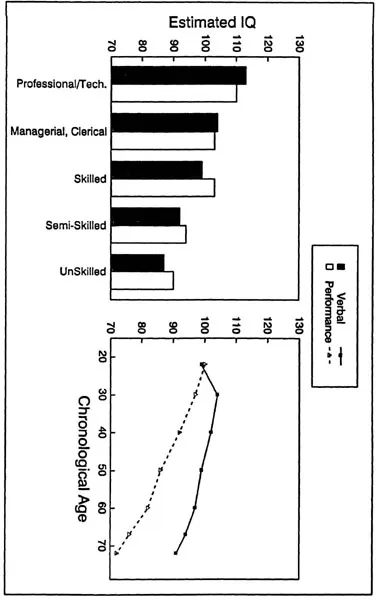
Figure 1.7 Mean Verbal and Performance IQs from the WAIS–R standardization sample as a function of occupational level and age. Occupational data from kaufman (1990)and age data derived from values reported inwehster(1981).
Measures of cognitive performance also have been found to be associated with success in various jobs. For example, validity coefficients for cognitive measures in the prediction of job proficiency have been found to range between .25 and .45 (e.g., Ghiselli, 1973; Hunter … Hunter, 1984). Because of their established validity, measures of cognitive performance are often used for purposes of selection. And because increased age frequently is associated with lower levels of cognitive performance, dramatically different selection consequences could occur if the same absolute performance criteria were used for all groups. This point can be made more concrete by reference to Figure 1.8, which illustrates the percentages at the top and bottom 10% of the reference distribution in distributions that have been shifted towards lower levels of performance. Both ends of the distributions are represented because the bottom 10% might serve as the rejection region for some positions, and the top 10% might function as the selection region for other positions.
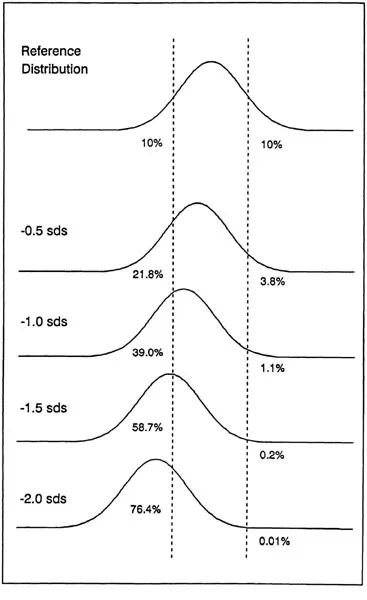
Figure 1.8 Illustration of percentages corresponding to the top and bottom 10% of areference distribution in distributions shifted various amounts relative to the reference distribution.
If, as the results illustrated in Figures 1.3, 1.4, and 1.5 suggest, the average adult in his or her 60s performs about 1 to 1.5 standard deviations below the average adult in his or her 20s, then he or she may be 4 to 6 times more likely to fall in the low rejection region, and only 1/9 to 1/50 as likely to fall in the high selection region. By virtually any standard, differences of this magnitude would be considered substantial.
I suspect that these kinds of measures of fluid or process cognition may be less important than acquired knowledge in predicting success in occupational situations as people accumulate experience and knowledge in a job. At the same time, however, I would also be surprised if fluid or process aspects of cognitive functioning were found to be completely independent of occupational success, particularly when performance is assessed on novel activities and in unfamiliar situations. This type of cognition therefore probably has at least some relevance for job performance at all stages of a career, and for many types of jobs.
All of the implications of the negative relations between age and certain measures of cognitive functioning are not yet understood. Nevertheless, because cognitive measures have been found to predict success in a variety of non-academic situations, the potential consequences of these relations could be great. Even if only for this reason, therefore, the phenomenon of negative relations between age and cognition appears important enough to justify serious efforts at explanation.
Assumptions and Biases
All research is guided by numerous implicit assumptions or biases. Because they may help explain the particular approach I have adopted in attempting to determine the mechanism...
Table of contents
- Cover
- Half Title
- Title Page
- Copyright
- Contents
- Preface
- Chapter 1. The Phenomenon and the Methods to Be Used in Its Investigation
- Chapter 2. Working Memory as a Potential Mediator
- Chapter 3. Processing Speed as a Potential Mediator
- Chapter 4. Summary
- References
- Author Index
- Subject Index
Frequently asked questions
Yes, you can cancel anytime from the Subscription tab in your account settings on the Perlego website. Your subscription will stay active until the end of your current billing period. Learn how to cancel your subscription
No, books cannot be downloaded as external files, such as PDFs, for use outside of Perlego. However, you can download books within the Perlego app for offline reading on mobile or tablet. Learn how to download books offline
Perlego offers two plans: Essential and Complete
- Essential is ideal for learners and professionals who enjoy exploring a wide range of subjects. Access the Essential Library with 800,000+ trusted titles and best-sellers across business, personal growth, and the humanities. Includes unlimited reading time and Standard Read Aloud voice.
- Complete: Perfect for advanced learners and researchers needing full, unrestricted access. Unlock 1.5M+ books across hundreds of subjects, including academic and specialized titles. The Complete Plan also includes advanced features like Premium Read Aloud and Research Assistant.
We are an online textbook subscription service, where you can get access to an entire online library for less than the price of a single book per month. With over 1.5 million books across 990+ topics, we’ve got you covered! Learn about our mission
Look out for the read-aloud symbol on your next book to see if you can listen to it. The read-aloud tool reads text aloud for you, highlighting the text as it is being read. You can pause it, speed it up and slow it down. Learn more about Read Aloud
Yes! You can use the Perlego app on both iOS and Android devices to read anytime, anywhere — even offline. Perfect for commutes or when you’re on the go.
Please note we cannot support devices running on iOS 13 and Android 7 or earlier. Learn more about using the app
Please note we cannot support devices running on iOS 13 and Android 7 or earlier. Learn more about using the app
Yes, you can access Mechanisms of Age-cognition Relations in Adulthood by Timothy A. Salthouse in PDF and/or ePUB format, as well as other popular books in Psychology & Developmental Psychology. We have over 1.5 million books available in our catalogue for you to explore.