- 352 pages
- English
- ePUB (mobile friendly)
- Available on iOS & Android
eBook - ePub
Generalized Additive Models
About this book
This book describes an array of power tools for data analysis that are based on nonparametric regression and smoothing techniques. These methods relax the linear assumption of many standard models and allow analysts to uncover structure in the data that might otherwise have been missed. While McCullagh and Nelder's Generalized Linear Models shows how to extend the usual linear methodology to cover analysis of a range of data types, Generalized Additive Models enhances this methodology even further by incorporating the flexibility of nonparametric regression. Clear prose, exercises in each chapter, and case studies enhance this popular text.
Trusted by 375,005 students
Access to over 1 million titles for a fair monthly price.
Study more efficiently using our study tools.
Information
CHAPTER 1
Introduction
1.1 What’s in this book
One of the most popular and useful tools in data analysis is the linear regression model. In the simplest case, we have n measurements of a response (or dependent) variable Y and a single predictor (or independent) variable X. Our goal is to describe the dependence of the mean of Y as a function of X. For this purpose we assume that the mean of Y is a linear function of X,
(1.1) |
The parameters α and β are usually estimated by least-squares, that is, by finding the values and that minimize the residual sum of squares. If the dependence of the mean of Y on X is linear or almost linear, the linear regression model is very useful. It is simple to compute and provides a concise description of the data.
It is easy to envisage data for which the linear regression model is inappropriate. If the dependence of E(Y) on X is far from linear, we wouldn’t want to summarize it with a straight line. We can extend straight line regression very simply by adding terms like X2 to the model but often it is difficult to guess the most appropriate functional form just from looking at the data. The point of view that we take here is: let the data show us the appropriate functional form. That is the idea behind a scatterplot smoother. It tries to expose the functional dependence without imposing a rigid parametric assumption about that dependence.
To make the ideas more concrete, let’s look at some data. Figure 1.1 shows a plot of a response variable
log(C-peptide) versus a predictor age, two variables from some diabetes data that are studied in this book (these data, and some other data sets, are described at the end of this chapter). It is quite clear from the graph that we wouldn’t want to fit a straight line to these data. Instead let’s apply a simple scatterplot smoother, the locally-weighted running-mean. Consider some fixed data point . We find the 11 data points closest in X-value to , and assign weights to them according to their distance in X from X0. We compute the weighted average of the Y-values of these 11 data points to produce , our estimate of the mean of Y at X0. Doing this for all the data points produces the curve in Fig. 1.1. The curve is smooth and follows the trend of the data fairly well. The underlying assumption that we have made here is that the dependence of the mean of Y on X should not change much if X doesn’t change much. This assumption is very often reasonable. We call the output of a scatterplot smoother a scatterplot smooth or simply a smooth. The smoother used here is discussed in more detail in section 2.11.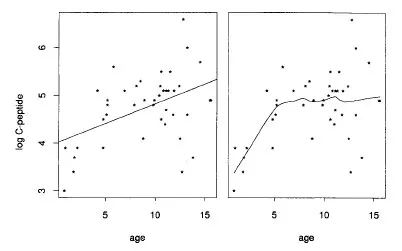
Fig. 1.1. Left figure shows a scatterplot of
log (C-peptide) versus age for the diabetes data, together with the least-squares regression line. The right figure shows the locally-weighted running mean smooth of log(C-peptide). It summarizes the relationship with age, and can be regarded as a nonparametric estimate of the regression of log (C-peptide) on age.Chapter 2 describes some basic scatterplot smoothers, like the running mean, locally-weighted running-line, kernel and cubic-spline smoothers, and also looks briefly at smoothers for multiple predictors.
In Chapter 3 we discuss some important issues such as how to choose the smoothing parameters (like the “10” above) for a given smoother, and how to make inferences about the fitted smooth.
One can think of a smooth as simply a description of the dependence of Y on X but if one is interested in building models, as we are here, a slightly more formal definition is in order. If we generalize the linear regression model (1.1) to
(1.2) |
where f(X) is an arbitrary unspecified function, then a smooth may be defined as an estimate of f(X).
More often than not, we have more than one predictor variable at our disposal. For example in the diabetes data there are five predictors and 43 observations. Let’s consider just two of the...
Table of contents
- Cover
- Title Page
- Copyright Page
- Dedication
- Table of Contents
- Preface
- 1 Introduction
- 2 Smoothing
- 3 Smoothing in detail
- 4 Additive models
- 5 Some theory for additive models
- 6 Generalized additive models
- 7 Response transformation models
- 8 Extensions to other settings
- 9 Further topics
- 10 Case studies
- Appendices
- References
- Author index
- Subject index
Frequently asked questions
Yes, you can cancel anytime from the Subscription tab in your account settings on the Perlego website. Your subscription will stay active until the end of your current billing period. Learn how to cancel your subscription
No, books cannot be downloaded as external files, such as PDFs, for use outside of Perlego. However, you can download books within the Perlego app for offline reading on mobile or tablet. Learn how to download books offline
Perlego offers two plans: Essential and Complete
- Essential is ideal for learners and professionals who enjoy exploring a wide range of subjects. Access the Essential Library with 800,000+ trusted titles and best-sellers across business, personal growth, and the humanities. Includes unlimited reading time and Standard Read Aloud voice.
- Complete: Perfect for advanced learners and researchers needing full, unrestricted access. Unlock 1.4M+ books across hundreds of subjects, including academic and specialized titles. The Complete Plan also includes advanced features like Premium Read Aloud and Research Assistant.
We are an online textbook subscription service, where you can get access to an entire online library for less than the price of a single book per month. With over 1 million books across 990+ topics, we’ve got you covered! Learn about our mission
Look out for the read-aloud symbol on your next book to see if you can listen to it. The read-aloud tool reads text aloud for you, highlighting the text as it is being read. You can pause it, speed it up and slow it down. Learn more about Read Aloud
Yes! You can use the Perlego app on both iOS and Android devices to read anytime, anywhere — even offline. Perfect for commutes or when you’re on the go.
Please note we cannot support devices running on iOS 13 and Android 7 or earlier. Learn more about using the app
Please note we cannot support devices running on iOS 13 and Android 7 or earlier. Learn more about using the app
Yes, you can access Generalized Additive Models by T.J. Hastie,R.J. Tibshirani in PDF and/or ePUB format, as well as other popular books in Mathematics & Probability & Statistics. We have over one million books available in our catalogue for you to explore.