Introduction to Remote Sensing: Digital Image Processing and Applications presents a unique textbook/downloadable resources package. It explains how digital images can be processed and offers practical hands-on experience of image processing. This package, which is ideal for student self-study, institutional or library purchase, shows how digital images can be processed to maximize information output and discusses a range of environmental monitoring techniques. A range of case studies are explored, drawn from a variety of disciplines and from across the world. The book also includes a practical manual of image processing instruction and detailed practical exercises to support the unique downloadable resources which accompanies the book.
The downloadable resources contain fully functioning image processing software - a limited edition of DRAGON software developed specifically for readers of Introductory Remote Sensing - and over 70 satellite digital datasets for 9 scenes across America, Ireland, China, Sudan, Peru, Western Europe and the UK.

eBook - ePub
Introductory Remote Sensing Principles and Concepts
- 216 pages
- English
- ePUB (mobile friendly)
- Available on iOS & Android
eBook - ePub
Introductory Remote Sensing Principles and Concepts
About this book
Trusted by 375,005 students
Access to over 1.5 million titles for a fair monthly price.
Study more efficiently using our study tools.
Information
1
INTRODUCTION TO AND HISTORICAL DEVELOPMENT OF REMOTE SENSING
Chapter Outline
1.1 Introduction to remote sensing
1.2 Historical development of remote sensing
Military reconnaissance satellites
Manned space flight
Meteorological satellites
Earth resources satellites
1.3 Photographs and images
1.4 Chapter summary
Self-Assessment Test
Further Reading
1.1 INTRODUCTION TO REMOTE SENSING
Remote sensing can be defined as the acquisition and recording of information about an object without being in direct contact with that object. Although this definition may appear quite abstract and divorced from everyday living, most people have practised a form of remote sensing in their lives. A photograph obtained by a camera is a record which provides information about an object. A simple photograph such as that shown in Plate 1.1a can introduce us to some important remote sensing concepts. Different components within the photograph are different colours: the shirt is red, the trousers green and the folder blue. This information about colour is carried by means of electromagnetic radiation and the colours represent specific ranges of the electromagnetic spectrum (see section 2.1). Spatial relationships between different components of a scene may also be determined from a photograph. On Plate 1.1a, the folder is held to the side of the figure at waist height and a building can be seen behind the person. However, in order to determine quantitative spatial information (for example, what is the area of the blue folder?), it is important that the scale of the photograph be known or an object of known length be included within the photograph. The metre rule held by the person allows the determination of distances and areas. Aspects of scale are considered in more detail in section 2.5.
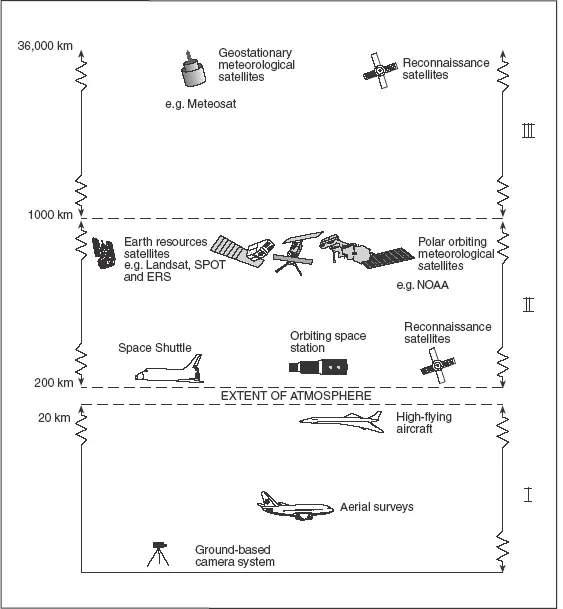
Although the photograph shown in Plate 1.1a is a simple form of remote sensing, the images in this book have been acquired by airborne or spaceborne sensors and not by ground-based means. Remote sensing images are obtained at distances that fall within three broad ranges (Figure 1.1):
| 1 | Sensors carried by aircraft generally obtain images at heights of 500 m to 20 km. In general most aerial surveys are carried out at heights of less than 5,000 m though some remote sensing experiments carried out in the United States of America have been typically performed at much higher altitudes (20 km) using converted U2 aircraft. |
| 2 | Sensors carried by spacecraft and satellites operate at distances of 250–1,000 km. Spacecraft (which are manned) generally operate at altitudes of around 250–300 km. The Russian government operates the MIR space station at altitudes of 300–400 km. Many remote sensing satellites (which are unmanned) operate approximately 1,000 km above the Earth. Examples of these types of space platforms are Landsat and SPOT (section 3.2). These systems provide data for a number of years and when they eventually fail, remain within their orbits whereas satellites in lower orbit may return to Earth in an uncontrolled manner and burn up as they pass through the atmosphere. Military surveillance satellites also operate within this 250–1,000 km zone. |
| 3 | Very high-altitude satellites operate 36,000 km above the Earth. These are geostationary satellites which have the unique capability of appearing to remain over the same part of the Earth at all times (section 3.3). |
Plate 1.1b is a variation of the photograph shown in Plate 1.1a but it illustrates a very important concept as regards remote sensing: varying the distance at which images are acquired allows different types of information to be extracted. Detailed information about the person cannot be discerned on Plate 1.1b but his relationship to the surroundings can now be determined. The usefulness of this information is dependent upon the particular part of the scene that one is attempting to gain information on. There is therefore no single image which can be considered the ‘best’; the optimum image is ultimately dependent upon the use that has to be made of it. Conversely, a close-up of Plate 1.1a would allow more information to be obtained on a small area, such as the blue folder, but at the expense of losing other information about the object. The ability to alter the distance from which the Earth is viewed and hence the resolution and the size of the area that is imaged is one of the most important attributes of remote sensing and allows it to be exploited in a wide variety of research fields. Small-scale images allow large areas of the globe to be analysed. Many current environmental concerns have a global dimension and are inextricably linked to climatic change.
The ability of satellites to provide a synoptic view of large parts of the Earth as an entity rather than in a piecemeal fashion is a major advantage. Such satellite images allow global problems to be viewed in a global context. Remote sensing should not be looked upon as a replacement for conventional field-based research but rather as a technique to complement it. ‘Ground truth’ is a commonly used (but misleading) term often applied to field investigations. Ground-collected verification data form an integral part of remote sensing. They provide an independent source of data and are important in the identification of features detected by remote sensing means. However, in many parts of the world ground-based research is minimal or researchers working far apart may not know of a common link between their researches. In addition, research is often confined to very narrow disciplines, often with little cross-referencing. Remotely sensed satellite images allow us to view the various components which comprise our environment (vegetation, cloud, rocks, cities) simultaneously. The interaction of many complex human-induced and natural processes produces the world that we live on today and global images allow us to analyse the interrelationship of these processes.
If remote sensing could only provide us with an overall view of the globe, while useful, its applications would be limited. Cloud patterns can be determined on Plate 1.2a, but apart from the lakes in eastern Africa and the River Nile in northeast Africa, little information can be obtained on land areas. Plate 1.2a would not be particularly helpful if we were interested in studying the British Isles. However, we may view the same area from different heights and at different scales by using different remote sensing systems. The British Isles is much more recognisable in Plate 1.2b, which is an image obtained by another remote sensing system, though the definition is still poor. A more detailed view of northeast Ireland is illustrated in Plate 1.2c and allows much more information to be extracted for this smaller region. Rectangular field patterns emerge showing the cultivated areas; different colours can be related to vegetational variations. Red shows healthy vegetation, blue mostly bare soil and the very dark regular signatures are coniferous forest plantations divided up by linear tracks shown as white lines. (The colours on this image are ‘false’ as they do not accord with what we see with our eyes. See following paragraph.) An oblique aerial photograph of part of the coastline shown in Plate 1.2c is illustrated in Plate 1.2d, in which individual rock layers in the cliff can be discerned. The versatility to observe large areas or very small ones (i.e. varying the scale) makes remote sensing techniques applicable over a wide range of disciplines. An aerial photograph or a satellite image which shows a lot of detail (high spatial resolution) would be suitable for a forest manager who wishes to measure the area of forest whereas a low spatial resolution image, which provides information over a large area, is ideal for the climatologist.
Another important aspect of remote sensing demonstrated in Plate 1.1 has not yet been discussed. Three colours predominate in Plate 1.1a: blue, green and red. Every colour that can be observed by the human eye is formed by a combination of these colours. For example, yellow is formed by an equal combination of red and green with no blue input (see Plate 2.1a and Chapter 2 for a fuller discussion). Red, green and blue represent only a very small part of the electromagnetic spectrum. A comparison of Plates 1.2c and 1.2d shows that, whereas the colours observed on the latter image appear natural, vegetation has a bright red signature on the former image. This is because it is a false colour image which has been produced from data obtained in a part of the electromagnetic spectrum which cannot be detected by the human visual system. Two different surfaces may appear similar to the human eye but if they are viewed at a different wavelength, outside the visual range, they can often be quite distinct. Computer technology allows us to ‘see’ wavelengths outside our normal visual range by using false colouration of these wavelengths. This ability to obtain information across a range of wavelengths, far greater than can be determined by the human eye, is another major advantage of remote sensing.
The production of an image such as that shown in Plate 1.2a is virtually an instantaneous record of the conditions that exist in a particular location at a specific time. If our environment was static this image would be a sufficient record of the events that occur at that location. However, the Earth is a dynamic system and natural forces are continually operating on it, causing it to evolve. Increasingly, human interference such as deforestation is accelerating these changes. Many remote sensing systems are designed to image the same location at periodic intervals; thus a record of the images obtained allows changes in the environment to be monitored and – more importantly – the rates at which these changes are occurring can be evaluated. An example of this important repeat facility is illustrated in Chapter 4, regarding the variation of ozone over Antarctica (see Plates 4.2a and 4.2b). The versatility shown by remote sensing systems regarding the area imaged and the wavelengths sensed, which has been discussed above, is mirrored in the different repeat cycles (i.e. how often an area is imaged). The Landsat system images most of the globe every 16 days and thus changes on a 16-day cycle can be determined. Such a repeat cycle is ideal for studying vegetational changes but would be entirely inappropriate for meteorological investigations because the atmospheric system alters much more rapidly. Consequently, meteorological satellites have much shorter repeat cycles, some as short as 30 minutes. When these properties of remote sensing systems are combined (the variation in area imaged and the detail obtained, the different wavelengths that can be sensed and the repetitive coverage that is available) and applied simultaneously in an investigation, then remote sensing techniques can be an extremely powerful approach for many applications which could not be attempted by conventional means. For example, using wavelengths at which vegetation is particularly sensitive, vegetational indices can be produced for entire continents. A gradual decline in a vegetation index over a number of years could be an indication that famine conditions are developing and following this warning, remedial action can be formulated and a possible catastrophe averted. Remote sensing is used extensively in Africa, where it is often the main or most reliable source of data. The Global and Early Warning System (GEWS) of the Food and Agriculture Organisation (FAO) in conjunction with the United States-funded Famine Early Warning System (FEWS) rely heavily on remotely sensed data for evaluating the possible development of famine conditions. Even if such a catastrophe occurs, remote sensing can still play an important role. During the drought and consequent famine in Eritrea in 1986, a team of researchers skilled in remote sensing techniques, based mainly at the Open University in the UK, analysed photographs of northeast Africa obtained by the Space Shuttle. The sites of potential sources of subsurface water were delineated from the photographs. The success rate for finding water by drilling at these specified locations was significantly greater than at other sites not identified from spaceborne sensors. Remote sensing has many applications, some of which are introduced in Chapter 4.
1.2 HISTORICAL DEVELOPMENT OF REMOTE SENSING
Remote sensing became possible with the invention of the camera in the nineteenth century. Astronomy was one of the first fields of science to exploit this technique and to this day much of astronomy is inextricably linked with remote sensing. A substantial amount of the progress in remote sensing has been as a result of ...
Table of contents
- Cover
- Half Title
- HE COMPLETEINTRODUCTORY REMOTE SENSINGTEACHING AND LEARNING PACKAGE
- Title Page
- Copyright Page
- Dedication
- Table of Contents
- List of Colour Plates
- List of Figures
- List of Tables
- Preface
- 1 INTRODUCTION TO AND HISTORICAL DEVELOPMENT OF REMOTE SENSING
- 2 PRINCIPLES OF REMOTE SENSING
- 3 REMOTE SENSING SYSTEMS
- 4 APPLICATIONS OF REMOTE SENSING
- Appendix A Answers to Self-Assessment Tests
- Appendix B Acronyms Used in Remote Sensing
- Appendix C Glossary of Remote Sensing Terms
- Appendix D Remote Sensing Sources of Information
- Appendix E Contributors to Introductory Remote Sensing
- Appendix F Further Reading
- Appendix G Preview of Introductory Remote Sensing: Digital Image Processing and Applications
- Index
Frequently asked questions
Yes, you can cancel anytime from the Subscription tab in your account settings on the Perlego website. Your subscription will stay active until the end of your current billing period. Learn how to cancel your subscription
No, books cannot be downloaded as external files, such as PDFs, for use outside of Perlego. However, you can download books within the Perlego app for offline reading on mobile or tablet. Learn how to download books offline
Perlego offers two plans: Essential and Complete
- Essential is ideal for learners and professionals who enjoy exploring a wide range of subjects. Access the Essential Library with 800,000+ trusted titles and best-sellers across business, personal growth, and the humanities. Includes unlimited reading time and Standard Read Aloud voice.
- Complete: Perfect for advanced learners and researchers needing full, unrestricted access. Unlock 1.5M+ books across hundreds of subjects, including academic and specialized titles. The Complete Plan also includes advanced features like Premium Read Aloud and Research Assistant.
We are an online textbook subscription service, where you can get access to an entire online library for less than the price of a single book per month. With over 1.5 million books across 990+ topics, we’ve got you covered! Learn about our mission
Look out for the read-aloud symbol on your next book to see if you can listen to it. The read-aloud tool reads text aloud for you, highlighting the text as it is being read. You can pause it, speed it up and slow it down. Learn more about Read Aloud
Yes! You can use the Perlego app on both iOS and Android devices to read anytime, anywhere — even offline. Perfect for commutes or when you’re on the go.
Please note we cannot support devices running on iOS 13 and Android 7 or earlier. Learn more about using the app
Please note we cannot support devices running on iOS 13 and Android 7 or earlier. Learn more about using the app
Yes, you can access Introductory Remote Sensing Principles and Concepts by Paul Gibson,With contributions from Clare Power in PDF and/or ePUB format, as well as other popular books in Technologie et ingénierie & Médias numériques. We have over 1.5 million books available in our catalogue for you to explore.