In 2000, for the first time, a majority of the world's population was living in cities. The trend towards increasing urbanization shows no sign of slowing and the third millennium looks set to be an unprecedentedly urban one.
'Making Sense of Cities' provides an up-to-date, vibrant and accessible introduction to urban geography. It offers students a sense of the patterns and processess of urbanization and the spatial organisation of cities, recognizing the significance of globalization, economics, politics and culture from a range of perspectives. Above all, it seeks to provide a relevant approach, inviting students to engage with competing theories of the urban and to assess them against the background of their own opinions and personal experience.
Examples and case studies are drawn from a range of international settings, from San Francisco to Shanghai, Sydney to Singapore, giving a genuinely global coverage. The book is written in a fresh and engaging stlye, and is fully illustrated throughout. It is designed to appeal to any student of the urban and will be essential to students of geography, urban studies, town planning and land economy.
- 288 pages
- English
- ePUB (mobile friendly)
- Available on iOS & Android
eBook - ePub
About this book
Trusted by 375,005 students
Access to over 1.5 million titles for a fair monthly price.
Study more efficiently using our study tools.
Information
1
URBANISATION PROCESSES AND PATTERNS IN AN ERA OF GLOBALISATION
INTRODUCTION
Definitions
Urbanisation is defined as an increase in the proportion of a country’s population living in urban centres. When it comes to comparing country-by-country trends, measuring urbanisation presents some difficulties because there is no international agreement about the size a settlement needs to reach to count as ‘urban’. Currently, the best estimate places the proportion of the world’s population living in urban centres at between 40 and 55 per cent depending upon the criteria used to define an ‘urban centre’ (United Nations 1996, 14). Just a small adjustment in the census definitions used by populous countries like India and China could make a considerable difference to this estimate of urbanisation.
The other source of variation in statistical estimates of urbanisation arises from the different administrative boundaries that city governments adopt, and what parts of the built-up and adjacent areas of a metropolis are then counted. Table 1.1 shows how estimates of city size can vary depending upon which administrative areas are counted in or out. For example, the Shanghai Autonomous Region, with a population approaching 19 million, covers over 6000 square kilometres of some of the most fertile land in China. As well as feeding Shanghai’s population, this hinterland supports a dense network of villages. The delimited boundary for ‘urban’ Shanghai spills over into densely populated countryside (Fig. 1.1).
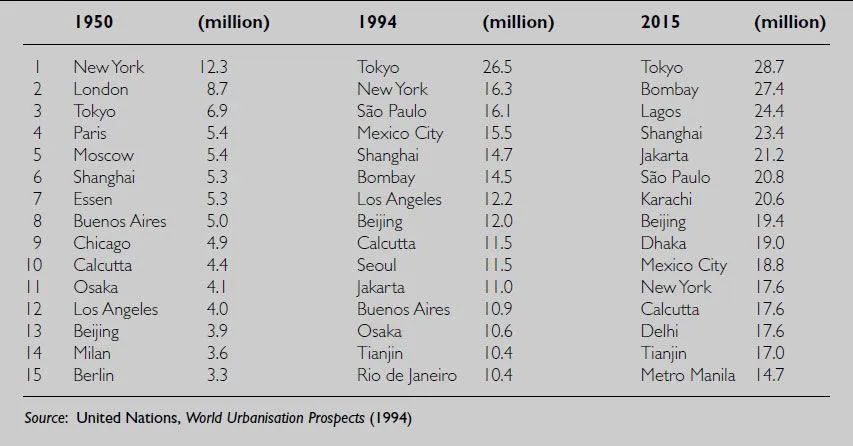
The continuing sprawl of urban regions in the United States also led to an updating of boundaries in the 1980s. The so-called functional urban region takes in all those daily commuters linked by their journey to work into the greater metropolitan labour market. By comparison, statistical definitions in European countries do not yet encompass this ‘functional urban region’ and as a consequence understate city size. In the United Kingdom by 1990, Glasgow, Liverpool and Newcastle would all have qualified as ‘million’ cities if the population within their functional urban regions had counted. This means that any league table of the world’s largest cities, such as Table 1.2, is always open to conjecture.
The other definitions that cause problems raise quite a different set of issues of usage. These are the bipolar categorisations ‘First World/Third World’ and ‘North/South’. It is difficult to avoid such usage in a text like this, so we should be clear about how this is intended. Globalisation is concentrating technology, market power and wealth within a group of countries roughly corresponding to the Organisation for Economic Cooperation and Development (OECD). These are often described as the First World bloc of countries and many of them were colonial powers that left colonies in a state of economic dependency. Former communist countries – or the Comecon bloc, an economic association of the Soviet Union’s east European satellites – made up a loosely described ‘Second World’ grouping. Before the fracturing of Euro-communism, that left a group of variously underdeveloped or less developed Third World countries in Asia, Africa and Latin America. United Nations publications now use the term ‘less developed countries’ (LDCs) because, as well as these geopolitical changes, uneven economic growth in the Third World is making for a more and more differentiated ‘South’.
TABLE 1.1 Examples of how city size varies with boundary definitions
City or metropolitan area | Date | Population | Area(km2) | Notes |
Beijing | 1990 | 2,336,544 | 87 | Four inner city districts including the historic old city |
(China) | c.5,400,000 | 158 | ‘Core city’ | |
6,325,722 | 1369 | Inner city and inner suburban districts | ||
10,819,407 | 16,808 | Inner city, inner and outer suburban districts and eight counties | ||
Dhaka | 1991 | 6 | Historic city | |
(Bangladesh) | c.4,000,000 | 363 | Dhaka Metropolitan Area (Dhaka City Corporation and Dhaka Cantonment) | |
6,400,000 | 780 | Dhaka Statistical Metropolitan Area | ||
< 8,000,000 | 1530 | Rajdhani Unnayan Kartipakhya (RAJUK) – the jurisdiction of Dhaka’s planning authority | ||
Katowice | 1991 | 367,000 | The city | |
(Poland) | 2,250,000 | The metropolitan area (Upper Silesian Industrial Region) | ||
c.4,000,000 | Katowice governorate | |||
Mexico City | 1990 | 1,935,708 | 139 | The central city |
(Mexico) | 8,261,951 | 1489 | The Federal District | |
14,991,281 | 4636 | Mexico City Metropolitan Area | ||
c.18,000,000 | 8163 | Mexico City megalopolis | ||
Tokyo | 1990 | 8,164,000 | 598 | The central city (23 wards) |
(Japan) | 11,856,000 | 2162 | Tokyo prefecture (Tokyo-to) | |
31,559,000 | 13,508 | Greater Tokyo Metropolitan Area (including Yokohama) | ||
39,158,000 | 36,834 | National Capital Region | ||
Toronto | 1991 | 620,000 | 97 | City of Toronto |
(Canada) | 2,200,000 | 630 | Metropolitan Toronto | |
3,893,000 | 5583 | Census Metropolitan Area | ||
4,100,000 | 7061 | Greater Toronto Area | ||
4,840,000 | 7550 | Toronto CMSA equivalent | ||
London | 1991 | 4230 | 3 | The original ‘city’ of London |
(UK) | 2,343,133 | 321 | Inner London | |
6,353,568 | 1579 | Greater London (32 boroughs and the city of London) | ||
12,530,000 | London ‘metropolitan region’ | |||
Los Angeles | 1990 | 3,485,398 | 1211 | Los Angeles City |
(USA) | 9,053,645 | 10,480 | Los Angeles County | |
8,863,000 | 2038 | Los Angeles-Long Beach Primary Metropolitan Statistical Area | ||
14,532,000 | 87,652 | Los Angeles Consolidated Metropolitan Area |
Source: United Nations (1996, 15). For notes on primary data, see original reference in text. Reproduced by permission of Oxford University Press
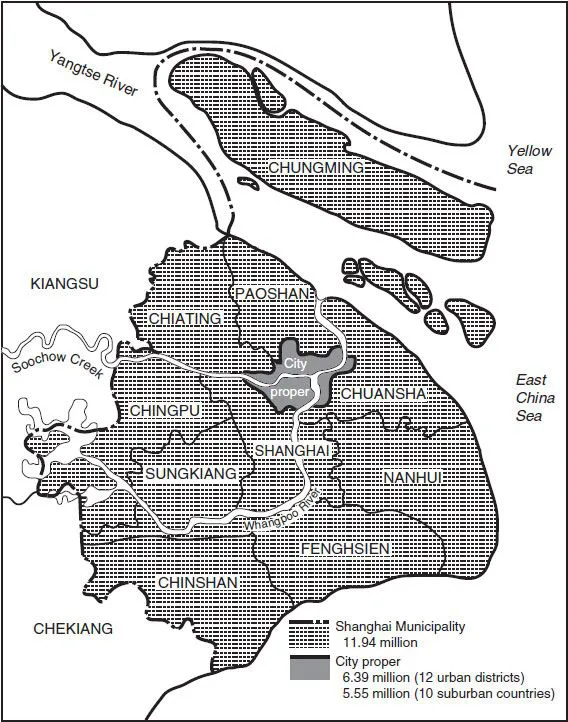
FIGURE 1.1 The administrative areas of Shanghai for which urban statistics are calculated, c. 1980
Source: Map of Shanghai Municipality
Notwithstanding the economic setback in Asia in 1987, a number of newly industrialising economies (NIEs) like Taiwan, Malaysia, Singapore, Indonesia and Thailand recorded impressive rates of growth during the 1980s. China was admitted to membership of the World Trade Organization in 2001 and is now cautiously opening up its huge market to foreign investors and goods. While South Asia and much of Africa have yet to be integrated into the new global economy in any meaningful way, most Latin American countries remain peripheral economies with the International Monetary Fund (IMF) dictating their economic policy.
One consequence of this is that the prospects of cities and regions around the world are subject to these differences in the degree of economic development and integration of countries into the new global economy. At the same time globalisation processes are breaking down such clear-cut distinctions in many cities. In In the Cities of the South, Jeremy Seabrook (1996) reminds us that political and business elites in Third World countries generally enjoy a ‘First World’ lifestyle and are insulated from the conditions that confront the residents of big cities like Bangkok, Calcutta or Dacca on a daily basis. Similarly ‘Third World’ conditions can now be found in global cities like New York, Los Angeles, London and even Sydney, where there is a thriving informal economic sector. To some extent the ‘hidden’ part of this informal economy exploits the ‘sweated labour’ of newly arrived immigrants.
TABLE 1.2 Actual (1950, 1994) and projected (2015) populations of the 15 largest cities in the world
URBANISATION AND MIGRATION
By the late 1990s, the International Labour Organization (ILO) estimated that, worldwide, there were about 120 million people on the move annually (Stalker 2000). The move into and between cities is the single most important factor behind the population shifts taking place globally. Each year, between 20 and 30 million people leave the land or small villages in the countryside to move into medium-sized towns and cities. Nevertheless, there has been some slight slowing in the overall rate of urbanisation on a worldwide basis in each of the decades since the 1950s (United Nations 1996). Importantly, how different cultures view the economic participation of women has a major bearing on the gender make-up of the migration streams and, ultimately, on the sex ratio of urban populations. In South Asia, North Africa, the Middle East and many parts of sub-Saharan Africa, more men move to the cities and head urban households because of customary prohibitions on the right of women to work outside the home. By contrast, in the towns and cities of East and Southeast Asia, and Latin America and the Caribbean, women outnumber men and head up more urban households simply because they leave the countryside in greater numbers (United Nations 1996, 12). In an era of globalisation, many of these rural to urban migrants originate in other countries and are contracted to work in cities where there is a domestic shortage of labour (see Chapter 5).
Apart from natural increase, rural to urban migration is only one set of flows that contributes to the changing level of urbanisation. Rural to rural moves take place in the countryside and in total may exceed cityward migration. In some countries, as migrants move up the urban hierarchy in pursuit of better prospects, people moving between cities outnumber those migrating from the countryside. Yet in the United States and Australia, where about one in five people changes location each year, there is little change to the degree of urbanisation because these are inter-or intra-city moves. Urban to rural migration, which takes a number of forms, is another source of change in the size of cities. This can be temporary, when city workers return to the rural area to visit or help with the harvest. Or it can be permanent if labour conditions deteriorate in the city, or when city workers decide to live in the countryside and commute to jobs in town. There are always people returning to the countryside,...
Table of contents
- Cover
- Half Title
- Title Page
- Copyright Page
- Table of Contents
- Preface
- Introduction
- 1 Urbanisation Processes and Patterns in an Era of Globalisation
- 2 Urban Systems and the Growth of Cities
- 3 Geography of Wealth Creation in Cities
- 4 Location of Economic Activities in Cities
- 5 Work Performed in Cities
- 6 Housing Markets and Residential Location in Cities
- 7 Social and Cultural Mosaic of Cities
- 8 City Environments and Living Conditions
- 9 Urban Politics and the Management of Cities
- 10 Outlook for the Urban Millennium
- References
- Index
Frequently asked questions
Yes, you can cancel anytime from the Subscription tab in your account settings on the Perlego website. Your subscription will stay active until the end of your current billing period. Learn how to cancel your subscription
No, books cannot be downloaded as external files, such as PDFs, for use outside of Perlego. However, you can download books within the Perlego app for offline reading on mobile or tablet. Learn how to download books offline
Perlego offers two plans: Essential and Complete
- Essential is ideal for learners and professionals who enjoy exploring a wide range of subjects. Access the Essential Library with 800,000+ trusted titles and best-sellers across business, personal growth, and the humanities. Includes unlimited reading time and Standard Read Aloud voice.
- Complete: Perfect for advanced learners and researchers needing full, unrestricted access. Unlock 1.5M+ books across hundreds of subjects, including academic and specialized titles. The Complete Plan also includes advanced features like Premium Read Aloud and Research Assistant.
We are an online textbook subscription service, where you can get access to an entire online library for less than the price of a single book per month. With over 1.5 million books across 990+ topics, we’ve got you covered! Learn about our mission
Look out for the read-aloud symbol on your next book to see if you can listen to it. The read-aloud tool reads text aloud for you, highlighting the text as it is being read. You can pause it, speed it up and slow it down. Learn more about Read Aloud
Yes! You can use the Perlego app on both iOS and Android devices to read anytime, anywhere — even offline. Perfect for commutes or when you’re on the go.
Please note we cannot support devices running on iOS 13 and Android 7 or earlier. Learn more about using the app
Please note we cannot support devices running on iOS 13 and Android 7 or earlier. Learn more about using the app
Yes, you can access Making Sense of Cities by Blair Badcock in PDF and/or ePUB format, as well as other popular books in Social Sciences & Urban Planning & Landscaping. We have over 1.5 million books available in our catalogue for you to explore.