3
Application 1 : Testing for the Factorial Validity of a Theoretical Construct (First-Order CFA Model)
Our first application examines a First-order CFA model designed to test the multidimensionality of a theoretical construct. Specifically, this application tests the hypothesis that self-concept (SC) for early adolescents (Grade 7) is a multidimensional construct composed of four factors: general SC (GSC), academic SC (ASC), English SC (ESC), and mathematics SC (MSC). The theoretical underpinning of this hypothesis derives from the hierarchical model of SC proposed by Shavelson, Hubner, and Stanton (1976). The example is taken from a study by Byrne and Worth Gavin (1996) in which four hypotheses related to the Shavelson et al. model were tested for three groups of children: preadolescents (Grade 3), early adolescents (Grade 7), and late adolescents (Grade 11). Only tests bearing on the multidimensional structure of SC, as it relates to Grade 7 children, are relevant to the present chapter. This study followed from earlier work in which the same four-factor structure of SC was tested for adolescents (see Byrne & Shavelson, 1986) and was part of a larger study that focused on the structure of social SC (Byrne & Shavelson, 1996). For a more extensive discussion of the substantive issues and the related findings, see the original Byrne and Worth Gavin (1996) article.
At issue in this first application is the plausibility of a multidimensional SC structure for early adolescents. Although numerous studies have supported the multidimensionality of the construct for Grade 7 children, others have counterargued that SC is less differentiated for children in their pre-and early-adolescent years (e.g., Harter, 1990). Thus, the argument could be made for a two-factor structure comprising only GSC and ASC. Still others postulate that SC is a unidimensional structure so that all facets of SC are embodied within a single SC construct (GSC). (For a review of the related literature, see Byrne, 1996.) The task presented here is to test the original hypothesis that SC is a four-factor structure comprising a general component (GSC), an academic component (ASC), and two subject-specific components (ESC and MSC) against two alternative hypotheses: (a) that SC is a two-factor structure comprising GSC and ASC, and (b) that SC is a one-factor structure in which there is no distinction between GSC and ASC. We now examine and test each of these hypotheses.
HYPOTHESIS 1 :
Self-Concept Is a Four-Factor Structure
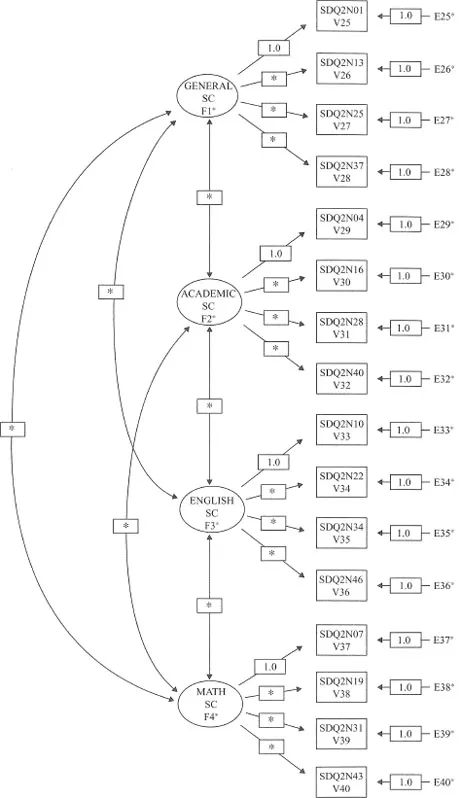
The model to be tested in Hypothesis 1 postulates a priori that SC is a four-factor structure composed of GSC, ASC, ESC, and MSC; it is presented schematically in Fig. 3.1, with asterisks representing parameters to the fully estimated.
Before discussing how to go about testing this model, let’s first dissect the model and list its component parts, as follows:
1.There are four SC factors, as indicated by the four circles labeled GENERAL SC, ACADEMIC SC, ENGLISH SC, and MATH SC.
2.The four factors are intercorrelated, as indicated by the two-headed arrows.
3.There are 16 observed variables, as indicated by the 16 rectangles (SDQ2N01-SDQ2N43); they represent item-pairs from the General, Academic, Verbal, and Math SC subscales of the Self-Description Questionnaire II (Marsh, 1992), respectively.
4.The observed variables load on the factors in the following pattern: SDQ2N01–SDQ2N37) load on Factor 1, SDQ3N04–SDQ2N40 load on Factor 2, SDQ2N10–SDQ2N46 load on Factor 3, and SDQ2N07-SDQ2N43 load on Factor 4.
5.Each observed variable loads on one and only one factor.
6.Errors of measurement associated with each observed variable (E25-E40) are uncorrelated.
After summarizing these observations, a more formal description of the hypothesized model is now presented. As such, the CFA model shown in Fig. 3.1 hypothesizes a priori that:
1.SC responses can be explained by four factors: General SC, Academic SC, English SC, and Math SC, respectively.
2.Each item-pair measure has a nonzero loading on the SC factor that it was designed to measure (termed a target loading) and a zero loading on all other factors (termed nontarget loadings).
3.The four SC factors, consistent with the theory, are correlated.
4.Error-uniquenesses1 associated with each measure are uncorrelated.
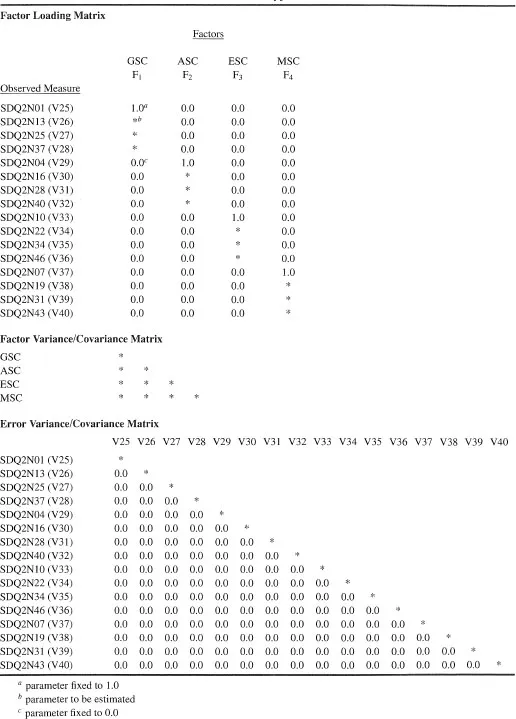
Another way of conceptualizing the hypothesized model in Fig. 3.1 is within a matrix framework as shown in Table 3.1. Thinking about the model components in this format can be very helpful because it is consistent with the manner by which the results from SEM analyses are commonly reported in program output files. Although EQS, as well as other Windows™-based programs, also provides users with a graphical output, the labeled information is typically limited to the estimated values and their standard errors. The tabular representation of the model in Table 3.1 shows the pattern of parameters to be estimated within the framework of three matrices: the factor-loading matrix, the factor variance-covariance matrix, and the error variance-covariance matrix. For purposes of model identification and latent variable scaling (see chap. 2), the first of each congeneric set of SC measures in the factor–loading matrix is set to 1.0,2 all other parameters are freely estimated (as represented by the asterisk [*]). Likewise, as indicated in the variance–covariance matrix, all parameters are to be freely estimated. Finally, in the error–uniqueness matrix, only the error variances are estimated; all error covariances are presumed to be zero.3
Provided with these two perspectives, let’s now move on to the actual testing of this four-factor hypothesized model. First, we review the EQS input file.
TABLE 3.1
Pattern of Estimated parameters for Hypothesized Four-Factor Model
We proceed by examining the link between the CFA model presented in Fig. 3.1 and the translation of its specifications into a file interpretable to EQS. This input file is shown in Table 3.2.
As described by the /TITLE paragraph, this file represents the initially hypothesized model representing a four-factor structure. The /SPECIFICATIONS paragraph indicates that (a) the sample size is 265, (b) there are 46 observed variables, (c) the method of estimation is maximum likelihood, (d) the data are in raw matrix form, and (e) the data are in fixed format, as described by the Fortran statement (40F1.0, X,6F2.0). This expression tells the program to read 40 single-digit numbers, to skip one column, and then to read six double-digit numbers. The first 40 columns represent item scores on the SPPC (not used in the present study) and the SDQ2; the remaining six scores represent scores for the MASTENG1 through SMAT1 variables (not used in the present study). Finally, note that the data reside as an external file called “ASC7INDM.ess.” However, a brief explanation of this specification is in order. Installation instructions accompanying EQS6.1 recommend that all files be kept in the program folder, in which case DATA specification in the input file would read as DATA= ‘ASC7INDM.ess’. The reason for the modified input in Table 3.2 is because I prefer to keep my working files separate from the program files. Therefore, I need to specify to the program exactly where these files can be found. Likewise, if users wish to operate in the same manner, they would simply specify the location of their data in accordance with their own computer.
By now, you will no doubt find the information specified in the next four paragraphs (/LABELS;/EQUATIONS;/VARIANCES;/COVARIANCES) to be fairly straightforward; thus, further explanation is unnecessary. However, the final two paragraphs introduced by the keywords /PRINT and /LMTEST are new and require elaboration. The /PRINT paragraph provides for printing of additional information that the manual states “make sense of a model and the quality of the estimates” (Bentler, 2005, p. 91). Some examples include the printing of a specified number of digits (DI=n; default=3), effect decomposition (EF=YES; Default=No), and additional goodness-of-fit indexes (FIT=ALL), which is the case with this input file.4 The /PRINT paragraph also allows for the generation of a RETEST file in which start values are automatically assigned to all estimated parameters by the program, a function that is illustrated in chap. 6.
The /LMTEST keyword requests that the Lagrange Multiplier Test (LM Test) be implemented to test hypotheses bearing on the statistical viability of specified restrictions in the model;5 in a CFA model, for example, that selected indicator variables load on specific factors. The basic idea underlying this test is to determine if, in a subsequent EQS run, certain parameters were specified as free rather than fixed, would it lead to a model that bet...