![]()
1 The dimensions of urban growth in the Third World
• Questions of definition
• Levels of urban population
• Rates and scales of growth
• Extended metropolitan areas
• Urban growth and economic development
• Conclusion
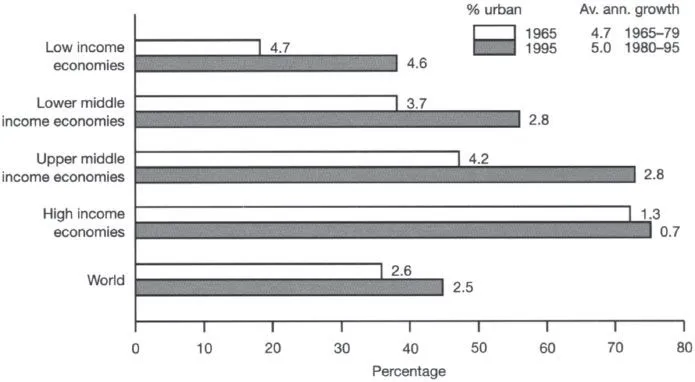
In 1990, for the first time, the World Bank recorded as many people living in urban settlements as in the countryside, with the global growth rate of urban populations rising at 4.5 per cent each year. As Figure 1.1 reveals, however, the principal component of this global growth comprises the low income countries. While the urbanisation process refers to much more than simple population growth and involves the examination of associated economic, social and political change, the starting point for such analysis is the demographic change which has brought so many people together in such a relatively short time; it is to this topic that the present chapter addresses itself.
Questions of definition
There is undoubtedly great diversity in the nature of urban growth in the Third World, as the Introduction pointed out. Even capital cities can range from small agglomerations of less than 20,000 in Pacific island states to the massive 20 million of Mexico City, while average annual urban growth rates during the 1980s and 1990s have oscillated between those in excess of 10 per cent, in Tanzania for example, and those of less than 2 per cent, such as in Sri Lanka. This diversity also extends to definitions of what is ‘urban’ or what constitutes a ‘city’. Each country tends to adopt its own criteria and these can vary enormously. In Peru, for example, an urban settlement is one which exceeds a hundred occupied dwellings; in India the figure is around 5,000 people. The definition clearly affects the overall percentage of the population officially classified as ‘urban’; in Peru it currently stands at 71 per cent, in India it is only 26 per cent and yet India contains many more cities with more than one million inhabitants.
Figure 1.1 Urban population as a percentage of total population, 1965–1995
Source: World Bank, World Development Report (1997).
Such variations make meaningful international comparisons very difficult, more so when urban totals are artificially affected by boundary issues. In China, for example, many cities incorporate extensive rural areas within their boundaries in order to ensure control over vital urban resource needs, such as water or energy. As a result, many official census returns often incorporate rural populations who have little direct contact with the urban core. Shanghai, for example, incorporates large areas of agricultural land within its designated area of over 6,000 square kilometres (UNCHS, 1996). These situations are further compounded by inaccurate registration systems, together with frequent changes to boundaries and official definitions of what is ‘urban’. In Vietnam, as a consequence of such problems, the official urban percentage of the total population showed a decline from 19.8 per cent to 19.4 per cent between 1989 and 1995, when in fact all other indicators revealed rapid urban growth, particularly in the largest cities.
In an effort to overcome these statistical variations, the various international agencies that collate information have at times attempted to standardise their data. The United Nations, for example, has recognised settlements of over 20,000 as ‘urban’, of more than 100,000 as ‘cities’ and of more than 5 million as ‘big cities’, but these standardisations have not become common usage. Other agencies, such as the World Bank, simply accept national definitions, and perhaps this is the appropriate approach. If such data reflect what each country considers to be historically, culturally and politically ‘urban’, then so be it. Why should some arbitrary, often westernised statistical base line be officially imposed?
Levels of urban population
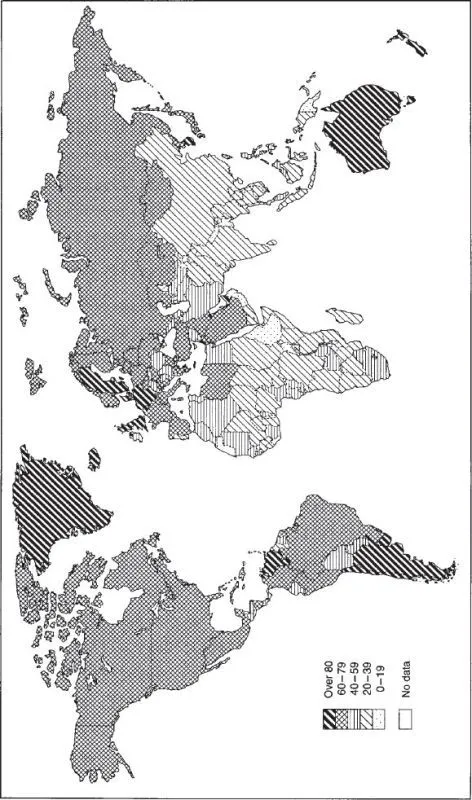
Figure 1.2 reveals very clearly that there are wide differences in the proportion of national populations that can be classified as urban. In very general terms some three-quarters of the population of developed countries are urban, compared to only one-third in developing countries; in the least developed countries only around 20 per cent of the population is urbanised. Of course, such broad figures conceal considerable variations within the Third World and many parts of Latin America are as urbanised as Europe, with individual cities such as São Paulo being amongst the most populous in the world.
In contrast, most of Africa is far less urbanised, containing many countries where more than 70–80 per cent of the population still live in rural areas. Variations to this general picture may be found in the north of the continent where a much longer history of urbanisation in countries fringing the Mediterranean has given rise to higher contemporary proportions. Asia appears to fall between Latin America and Africa in terms of level of urbanisation and also to be a little more uniform in its urban character, but a distinct split has emerged over the last decade or so between the South Asian bloc centred on India and the Pacific Asian bloc, including China. In the latter, urban population levels are much higher than in the former, a phenomenon which has been associated with industrialisation. But whatever the national proportion, Asian countries tend to be characterised by both very large cities and by dense rural populations, often in the areas around these cities. The contrasts between the urban and rural ways of life are consequently at their most intense in many parts of Asia.
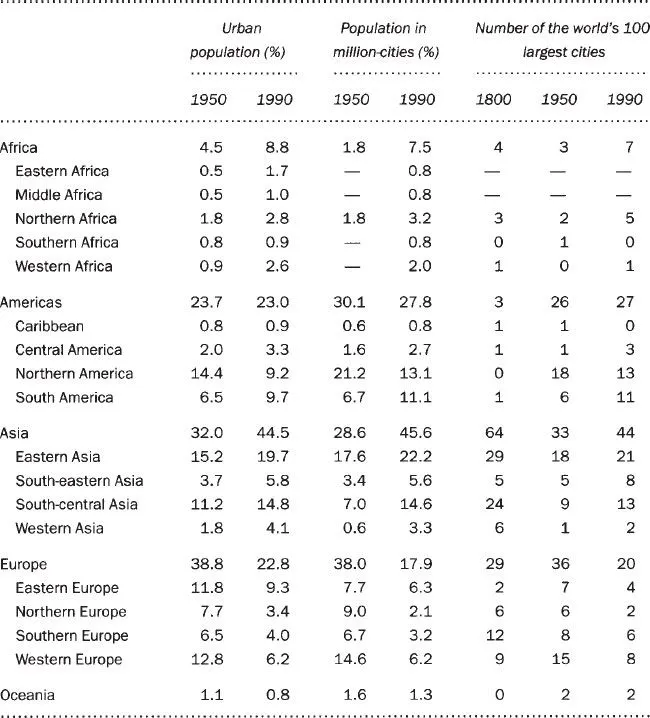
There are, therefore, considerable variations within and between the different regions and countries of the Third World with respect to the level of urban population. Moreover, these contrasts have varied enormously throughout the last two centuries, with the ‘interruption’ of the rapid urbanisation process during the industrialisation of Western Europe now being overtaken once more by Asia and with the extreme pace and scale of Latin American urban growth becoming ever more prominent (Table 1.1). But if the broad contrast made earlier between the contemporary developing and developed world holds true, why should we be so concerned with urban sustainability in the Third World when nations are much more likely to be heavily urbanised in the West? The answer, of course, lies not in the level of urbanisation but in its sheer scale and rate of growth.
Figure 1.2 Urban population as a percentage of total population, 1998
Table 1.1 The regional distribution of the world’s population in ‘million-cities’ and the location of the world’s largest 100 cities, 1800, 1950 and 1990
Source: UNCHS (1996).
Rates and scale of growth
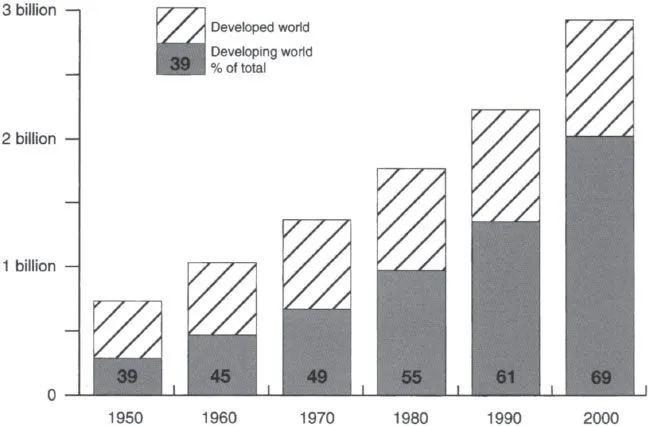
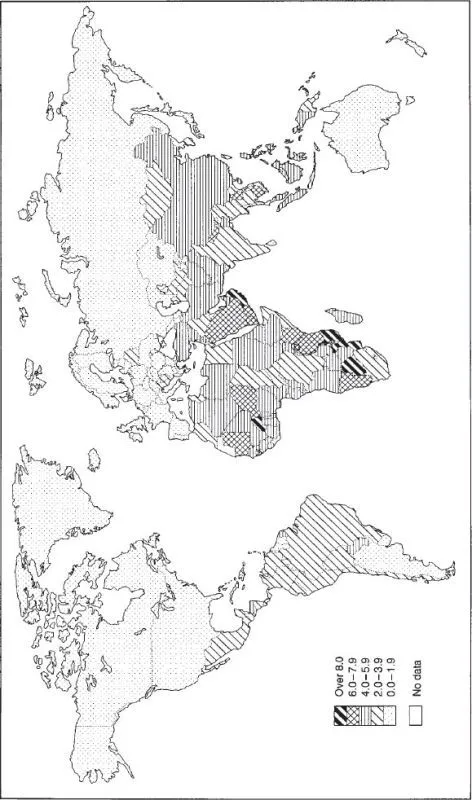
Between 1950 and 1975 the urban population of the Third World grew by 400 million and by 2000 will have increased by a further billion. Little wonder that in terms of absolute numbers, there are now twice as many urbanites in the Third World as there are in developed countries (Figure 1.3). Perhaps more importantly, the rate of increase of these respective totals is such that in low-income countries urban growth rates exceed those of the developed world by more than five times. Figure 1.4, therefore, indicates quite a different spatial pattern compared to Figure 1.2—almost a reverse image and more illustrative of the countries and regions where rapid urban growth poses severe problems. To put the comparison into historical perspective, the urban growth in Europe (including Russia) throughout the whole of the nineteenth century amounted to some 45 million people, a total exceeded by China alone during the 1980s. The principal causes of this unprecedented growth will be discussed in Chapter 3.
Figure 1.3 World urban population composition, 1950–2000
Source: World Bank, World Development Report (1997); UNCHS (1996).
Figure 1.4 Annual average growth rate of urban population, 1980–1998
One apparently undeniable feature of contemporary urban population growth is the way in which the largest cities appear to have been growing at the most rapid rates. A phenomenon which has given rise to the concept of urban primacy—the demographic, economic, social and political dominance of one city over all others within an urban system. It is undoubtedly true that by the end of the twentieth century the world’s 20 most populous cities will have switched from a Euro-American focus to a clear Third World bias within a mere 20 years. It is also true that in some developing countries primacy is very marked (Case Study B). In Vietnam, for example, it is variously estimated that between one-third and one-half of all urban dwellers live in either Ho Chi Minh City or Hanoi, giving the country one of the proportionately smallest but most concentrated urban populations in the world. However, we must not overemphasise this phenomenon. Most urban dwellers in the Third World do not live in mega-cities. Urban primacy is not, therefore, exclusive to developing countries; it has been, and continues to be, a feature of many European countries such as Greece, Austria, Portugal and Ireland. Moreover, there is extensive evidence from Latin America that the growth rates of the largest cities have slowed down considerably as problems of sustainability, such as poverty, become more serious.
In the past there has been a preoccupation with the urban primacy in the Third World and this led to the emergence of theories in which such features were said to be illustrative of serious developmental problems. Affected countries were alleged to be ‘overurbanised’ or possessed of ‘abnormal’ urban hierarchies ver...