- 248 pages
- English
- ePUB (mobile friendly)
- Available on iOS & Android
eBook - ePub
The Economics of Fire Protection
About this book
This important new book, the first of its kind in the fire safety field, discusses the economic problems faced by decision-makers in the areas of fire safety and fire precautions. The author considers the theoretical aspects of cost-benefit analysis and other relevant economic problems with practical applications to fire protection systems. Clear examples are included to illustrate these techniques in action.
The work covers:
* the performance and effectiveness of passive fire protection measures such as structural fire resistance and means of escape facilities, and active systems such as sprinklers and detectors
* the importance of educating for better understanding and implementation of fire prevention through publicity campaigns and fire brigade operations
* cost-benefit analysis of fire protection measures and their combinations, taking into account trade-offs between these measures.
The book is essential reading for consultants and academics in construction management, economics and fire safety, as well as for insurance and risk management professionals.
Trusted by 375,005 students
Access to over 1.5 million titles for a fair monthly price.
Study more efficiently using our study tools.
Information
Chapter 1: Fire protection economics: Introduction and background
Components of fire damage
Fire in any one building is a rare event. But in a population of buildings in a country fires occur frequently and destroy life and property. In the United Kingdom, for example, public fire brigades attend more than 400,000 fires every year in which about 800 people are killed and 15,000 sustain non-fatal injuries. In addition, a number of fires occur which are not reported to the public fire brigades; some of these are dealt with by industrial fire brigades. Currently, fires in the UK cost more than £1,000 million per year in direct material damage to buildings and their contents. About 30 per cent of this total loss is in large fires, each costing £50,000 or more.
In addition to direct damage to life and property, some fires cause indirect/ consequential losses, as discussed in Chapter 9. These losses associated with fires are incurred after the fires are extinguished and include, in the case of life damage, the distress and financial loss suffered by the family of an individual sustaining fatal or non-fatal injury. In the case of material damage, particularly that occurring in industrial and commercial properties, consequential losses arise due to loss of production, of trade, e.g. profits, of employment, of market share, of reputation and of exports and costs towards extra imports. Estimation of such consequential losses involves the application of complex statistical and economic techniques. For the reasons discussed in Chapter 9, if indirect losses and gains due to all fires occurring in a country are added together, their net contribution to the indirect loss at the national level is likely to be small. For example, this sum could have been about £90 million in the UK in 1993 when the estimated direct material loss was £900 million. This estimate of indirect loss is based on statistics produced by Wilmot (1996) (see also Table 2.1, p. 18).
Apart from direct and indirect losses, national fire costs (Fry, 1964) include those incurred by fire brigades run by government, for example, local authorities in the UK, and by major industrial firms, the administration costs of fire insurance companies and fire protection costs. The sum of all the costs mentioned above is defined as the total cost of fire. There are also other costs incurred mostly by government bodies towards the enforcement of fire safety and the formulation of safety standards, codes and regulations.
Fire damage in different countries
For purposes of international comparisons, direct and indirect fire losses and other fire costs are usually expressed as percentages of gross domestic product (GDP) and fire deaths per 100,000 persons. Table 1.1 contains the latest figures compiled by Wilmot (1996) of the World Fire Statistics Centre sponsored by the Geneva Association. For most of the countries for which complete data are available, the total cost of fire is more than three times the direct loss. Hungary has the highest number of fire deaths per 100,000 persons, followed in order by Finland, the USA, Denmark, Norway, Canada, Japan and the UK. Building size, design and constructional materials may be major factors affecting this ratio.
The trend in the annual direct fire loss expressed as a percentage of GDP during the period 1984–93 is shown in Figure 1.1 for a few countries for which data were available. For some of these countries the trend in this percentage for the period 1955–68 has been analysed by Ramachandran (1970a) and for 1965–74 by Appleton (1980). The variation in the percentage from country to country is, perhaps, a reflection of the economic state of the nation rather than of the fire losses. The chances of fire occurrence would generally increase with increasing industrial and commercial activities. However, this does not appear to be the case in Japan, where fire losses are increasing at a slower rate than the GDP.
GDP is not a satisfactory measure of the total burnable value at risk; it is only the total value of goods and services produced during a year. Gross fixed capital stock (GFCS) appears to be a better denominator for expressing fire costs as percentages although it only includes fixed assets i.e. buildings, plant and machinery, and not consumer durables. It is very difficult to estimate GFCS, whereas annual information on gross fixed capital formation (GFCF) is available for some countries. Ramachandran (1970a) compared direct fire losses in various countries during 1963–8 by expressing the loss as a percentage of GFCF. The trend in this percentage during 1984–93 is shown in Table 1.2. The ratio of loss: GFCF is somewhat high for Belgium. It has not increased significantly over the years for most of the countries but has varied from country to country due, perhaps, to differences in the economic conditions.
Analysing the data for the fourteen-year period 1955–68, Ramachandran (1970a) corrected the direct losses in various countries for inflation using consumer price index numbers and expressing them at 1955 prices in sterling (£) equivalents. He also calculated corrected losses per fire for the period 1961–8 which did not show any significant increase in most of the countries. According to this analysis, inflation and the increasing frequency of fires were major factors contributing to the increasing fire losses during 1955–68. The need for more fire prevention activities was apparent, although fire protection and fire fighting efforts were generally successful.
Table 1.1 International fire costs comparisons
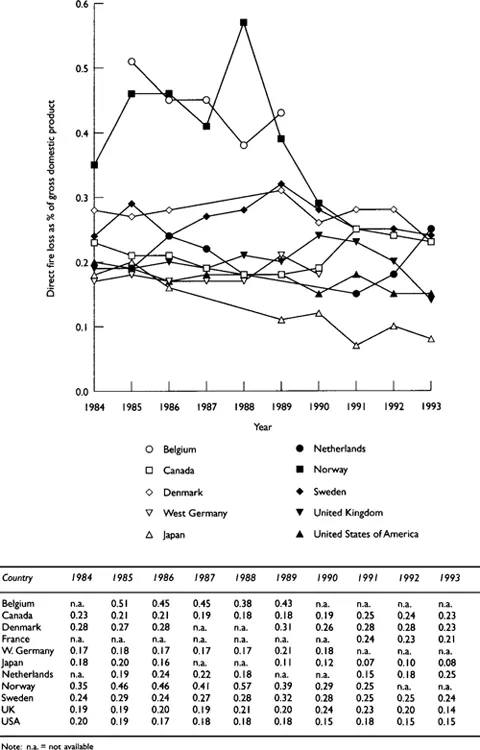
Figure 1.1 Direct fire loss as a percentage of gross domestic product
Table 1.2 Direct fire loss/gross fixed capital formation (%)
The conclusion mentioned above may be true with regard to fire losses in various countries during recent years. Table 1.3, for example, relates to the United Kingdom, for which data were readily available for analysis. Figures for direct losses are based on the statistics published by the World Fire Statistics Centre. Indices for retail prices are based on the figures for ‘all items’ given in the Annual Abstract of Statistics, 1995 (p. 336, Table 18.7). Figures for number of fires in occupied buildings have been obtained from Fire Statistics United Kingdom, which is an annual publication of the Home Office. It has been assumed that most of the monetary losses occurred in occupied buildings, although there may have been some contribution to the losses from outdoor and ‘secondary’ fires such as those in road vehicles, on grassland and heath-land and in chimneys. Apart from a sharp jump in 1989, the frequency of fires, both total and in occupied buildings, has not increased significantly between 1983 and 1993. Hence, inflation appears to be the major factor contributing to the increasing fire losses in the UK during recent years.
Per capita loss was increasing in most countries during 1961–8 (Ramachandran, 1970a) and 1965–74 (Appleton, 1980) and varied from country to country, due perhaps to differences in living standards. Some allowances for these differences can be made by dividing loss per head by the average hourly earnings in manufacture (see Fry, 1964).
Ramachandran (1970a) commented that figures for different countries are not strictly comparable due to differences in methods of collecting and classifying fire loss data. For instance, major databases in most countries record only those fires attended by public fire departments and exclude small fires extinguished by industrial fire brigades, sprinklers and portable fire extinguishers. Types of fires reported to authorities can vary significantly from country to country: some countries exclude chimney, brush, rubbish or forest fires while others include them; some countries include all losses except those occurring in government properties. There are also wide differences in the values of the properties involved in fires. Methods of estimating fire losses are also likely to vary from country to country. Fluctuations in exchange rates do not help matters.
Table 1.3 Direct fire loss per fire, adjusted for inflation, United Kingdom
Some of the points mentioned above were considered by Rardin and Mitzner (1977) in a detailed investigation supported by the US National Fire Prevention and Control Administration, National Fire Data Center. The authors systematically reviewed the various hypotheses and theories which have been advanced to explain fire loss differences between nations. The additional factors enumerated by them fall into three broad categories. First, there are differences between countries in human factors: economic and technological development, social and cultural patterns. Second, there are physical differences relating to building construction, contents and utility systems of buildings, weather, etc. A third major class of theories centres on variations in the organisation and functioning of the professional fire communities in different countries. There are other minor factors which include the severity with which fire safety codes are enforced and the influence of fire insurance on fire protection planning.
Management of fire risk
In order to reduce the national wastage due to fires, individuals, organisations and the government in any country have a clear duty to manage or control the risk posed by fires. Major industrial and commercial firms in many countries have developed plans for managing fire risk which involves three main phases: before the fire, during the fire and after the fire. The first task in the first phase is concerned with the identification of potential sources of ignition likely to initiate fires. These include human sources, such as the careless disposal of matches and smokers’ materials, and non-human sources, such as defective wiring to electrical appliances and mechanical heat or sparks in industrial buildings. The second task in the first phase is concerned with the identification of combustible materials or objects which can contribute to a rapid spread of fire, smoke and toxic gases. Examples of such materials are polyurethane-upholstered seats, materials used in the construction and lining of roofs, walls and ceilings, and the construction and covering of floors.
The next stage in the fire risk management of a property relates to risk evaluation; this is the third task in the first phase. In this stage, fire risk is evaluated qualitatively and, if possible, quantitatively by assessing the number of fires due to different ignition sources likely to occur in the property during, say, a year and the probable damage in each fire. Several mathematical models have been developed for this purpose. These include probabilistic and other nondeterministic techniques which take into account the random nature of the fire phenomenon (see Ramachandran, 1988, 1991a).
If the annual loss likely to be incurred in fires is of an unacceptable level, possible removal of most of the ignition sources should be considered as the first step in a risk-reduction or loss-control procedure. This task is executed by adopting fire prevention measures such as providing smoking lobbies, issuing notices to make people aware of fire risk due to smoking materials, periodically checking electrical appliances, and electrical rewiring, if necessary. Since it may be difficult to eliminate all the sources of ignition, it would be prudent to install in a building appropriate fire protection measures which, in the event of a fire breaking out, would reduce the extent of damage and enable the occupants to evacuate the building rapidly and safely. These measures, apart from building design and structural fire protection, include automatic fire alarms and detectors, sprinklers, smoke control systems, portable fire extinguishers and fire doors. All the fire safety measures mentioned above should be maintained in good order such that they perform satisfactorily if a fire occurs.
When fires do occur in spite of all fire prevention measures, it is necessary to initiate appropriate actions to provide all necessary assistance to occupants to reach a place of safety inside or outside the building. These actions are part of a fire emergency plan (FEP) and include tasks such as informing the fire brigade, attacking the fire and assisting the fire brigade. An FEP which has to be executed during the fire (second phase) should be prepared well in advance. The staff of a large establishment may be trained in carrying out the FEP satisfactorily. Occupants of a building should be trained for evacuation by staging fire drills periodically.
The third phase is concerned with actions to be undertaken after the fire. These include salvage operations, repairs to damaged parts of the building and restarting as soon as possible the industrial, commercial or other form of activity interrupted by the fire incident. During this phase, the financial damage is assessed and a claim is made to obtain insurance compensation. There is no need to emphasise the importance of having adequate fire insurance to cover direct and indirect/consequential losses. A large fire might seriously disrupt or even bankrupt a business or industrial activity.
Economics of fire protection
As discussed in the previous section, property owners, organisations, the government and society at large should adopt fire prevention and protection measures and other fire risk management activities in order to control the risk posed by fires. But these measures and activities involve considerable amounts of money being spent at all levels of a national economy. The questions, therefore, arise: How much control and at what cost?
With advances in fire science and engineering, it may be possible to reduce fire control costs by improved techniques of building construction, efficient sprinklers and detectors with optimum spacing between heads and so forth. The problem, however, is not merely to minimise fire protection costs but to improve their effectiveness in economic terms. The tenet that an investment should produce a profit applies equally as well to fire control as to general business ventures. For economic justification, the income or revenue from a project should exceed the expenditure or investment. In a broader sense, benefits from a project, direct and indirect, tangible and intangible, should be greater than the costs involved. Although this is a simple criterion to follow, a few problems arise when it is applied to fire safety measures. These problems are discussed in the next chapter.
Cost-benefit analysis
The first step in an economic analysis of different investment projects is concerned with the enumeration of relevant costs and benefits associated with each project (Chapter 2). Fire loss is an uncertain (probable) cost which will be incurred only if a fire breaks out (pp. 11–12) whereas fire protection costs and insurance premiums will certainly be incurred whether a fire occurs or not. During the next step, the costs and benefits are reduced to an annual basis using one of the methods discussed in Chapter 3.
An investment project can be economically justified if the aggregate value of annual benefits exceeds that of the annual costs. In other words, the ratio between the aggregate values of annual benefits and costs, known as benefit-cost ratio (see pp. 31–2), should exceed unity. This ratio is generally used for the selection and comparison of alternative investment projects.
A benefit component due to a fire protection device is assessed as the difference in the corresponding cost components for the two cases: with and without the device. For example, the reduction in the fire insurance premium due to the installation of the device is a benefit. If each case is considered separately, the insurance premium is a component of total cost. Hence, the fire protection strategy which minimises the total cost provides the economically optimum level of fire safety (see pp. 34–7). Watts (1988) has discussed briefly the techniques mentioned above.
Chapter 5 discusses the application of cost-benefit analysis to a few fire protection measures which have been considered effective in reducing fire risk or enhancing fire safety. These measures are considered individually with regard to their economic value. A combination of two or more measures can be expected to provide more safety than one alone but it may not be cost-effective. This aspect, which has not so far been investigated seriously in fire science literature, is discussed in Chapter 6. There is also an interaction between fire protection and insurance, and this is the subject matter of the last section of Chapter 6.
Other topics
A decision-maker is confronted with various fire protection measures from which he/she has to choose a measure or a combination of measures which minimises the total cost. This selection process can be carried out systematically by applying the decision tree technique (see pp. 116–19). Probability estimates considered in this exercise can be updated in the light of further information. The method generally used for this purpose is known as Bayesian technique (see pp. 127–30).
The amount of money property owners will be willing to spend on fire safety and insurance depends on factors such as their attitude to and assessment of fire risk and value of assets. If property owners are ‘risk-neutral’, they will use the actual mo...
Table of contents
- Cover Page
- Title Page
- Copyright Page
- Figures
- Tables
- Retail prices index
- About the Author
- Preface
- Chapter 1: Fire protection economics: Introduction and background
- Chapter 2: Costs and benefits: Enumeration, decision-making and uncertainty
- Chapter 3: Annual costs and benefits: Methods of calculation
- Chapter 4: Cost-benefit analysis
- Chapter 5: Cost-benefit evaluation of fire safety measures
- Chapter 6: Interactions and trade-offs
- Chapter 7: Decision analysis
- Chapter 8: Utility theory
- Chapter 9: Consequential/indirect loss
- Chapter 10: Monetary value of human life
- Chapter 11: Fire insurance
- Chapter 12: Fire protection economics: Summary of analytical methods
- Bibliography
Frequently asked questions
Yes, you can cancel anytime from the Subscription tab in your account settings on the Perlego website. Your subscription will stay active until the end of your current billing period. Learn how to cancel your subscription
No, books cannot be downloaded as external files, such as PDFs, for use outside of Perlego. However, you can download books within the Perlego app for offline reading on mobile or tablet. Learn how to download books offline
Perlego offers two plans: Essential and Complete
- Essential is ideal for learners and professionals who enjoy exploring a wide range of subjects. Access the Essential Library with 800,000+ trusted titles and best-sellers across business, personal growth, and the humanities. Includes unlimited reading time and Standard Read Aloud voice.
- Complete: Perfect for advanced learners and researchers needing full, unrestricted access. Unlock 1.5M+ books across hundreds of subjects, including academic and specialized titles. The Complete Plan also includes advanced features like Premium Read Aloud and Research Assistant.
We are an online textbook subscription service, where you can get access to an entire online library for less than the price of a single book per month. With over 1.5 million books across 990+ topics, we’ve got you covered! Learn about our mission
Look out for the read-aloud symbol on your next book to see if you can listen to it. The read-aloud tool reads text aloud for you, highlighting the text as it is being read. You can pause it, speed it up and slow it down. Learn more about Read Aloud
Yes! You can use the Perlego app on both iOS and Android devices to read anytime, anywhere — even offline. Perfect for commutes or when you’re on the go.
Please note we cannot support devices running on iOS 13 and Android 7 or earlier. Learn more about using the app
Please note we cannot support devices running on iOS 13 and Android 7 or earlier. Learn more about using the app
Yes, you can access The Economics of Fire Protection by Ganapathy Ramachandran in PDF and/or ePUB format, as well as other popular books in Business & Architecture Methods & Materials. We have over 1.5 million books available in our catalogue for you to explore.