Recent changes in policy and law, along with advances in research, are making it necessary for an increasing number of school psychologists, special educators, and teacher consultants to develop skills in areas other than psychoeducational assessment. In response to this need, many professionals and students are expanding their careers to include the field of instructional consultation -- the synthesis of school- based consultation techniques and a solid knowledge of effective instructional practices. This book examines the major themes of instruction and gives a step-by-step outline of the consultation process from referral to the final report. Recent changes in policy and law, along with advances in research, are making it necessary for an increasing number of school psychologists, special educators, and teacher consultants to develop skills in areas other than psychoeducational assessment. In response to this need, many professionals and students are expanding their careers to include the field of instructional consultation -- the synthesis of school- based consultation techniques and a solid knowledge of effective instructional practices. This book examines the major themes of instruction and gives a step-by-step outline of the consultation process from referral to the final report.
- 304 pages
- English
- ePUB (mobile friendly)
- Available on iOS & Android
eBook - ePub
Instructional Consultation
About this book
Trusted by 375,005 students
Access to over 1.5 million titles for a fair monthly price.
Study more efficiently using our study tools.
Information
Topic
EducationSubtopic
Education GeneralAppendix C
PART I
STEPS IN CONDUCTING DIRECT ACADEMIC ASSESSMENT 1
1. Determining Desired Academic Progress
The first step is to determine the rate at which typical students master the scope and sequence of a given curriculum. That becomes the criterion measure for desired progress. Three alternatives are suggested for determining criteria for desired progress. The most straightforward method for determining what is expected for typical students in a particular classroom is to ask the teacher. Usually, teachers can specify minimum expectations for average performance in their classroom curricula. A list of the sequenced objectives and approximate completion dates for each needs to be generated (e.g., see Fig. C-l).
If teachers are unable or unwilling to specify these expectations, there may be school-district criteria for minimum progress. A third way is to establish district or school norms for the curriculum based on actual performance of the children (Shinn, 1985).
After the data are obtained, a graph is constructed. The abscissa is divided into equal time units. The ordinate displays that sequence of materials or objectives for the children according to the time in which the average student is expected to master each unit. A diagonal line is drawn, from left to right, to represent average progress through that period of time in the curriculum atissue. Figure C-2 demonstrates how average performance on phonics in one school system might be graphed, based on the scope and sequence in Figure C-l. We now have, based on this example, a picture of the expected time it takes for average pupils to progress through the four-year reading phonics curriculum.
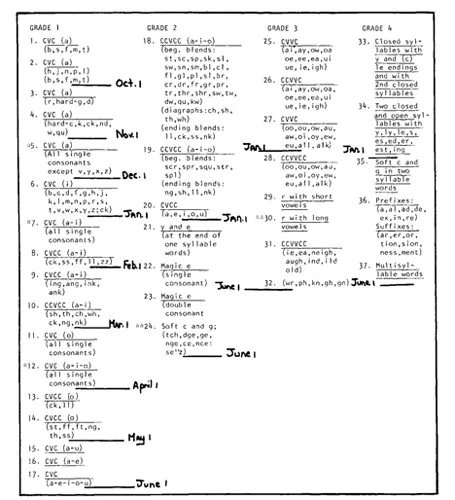
FIGURE C-1. Expected Progress for Average Students in Phonics. From “Phonetically Regular Words for Use in Teaching and Testing Both Reading and Spelling” by B. Gallistel and E. K. Ellis, 1970, Reading and Spelling Categories, Minneapolis, MN: Department of Psycho-educational Studies, University of Minnesota. Adapted by S. L. Deno and P. K. Mirkin in Data-Based Program Modification: A Manual, p. 79. Reprinted by permission.
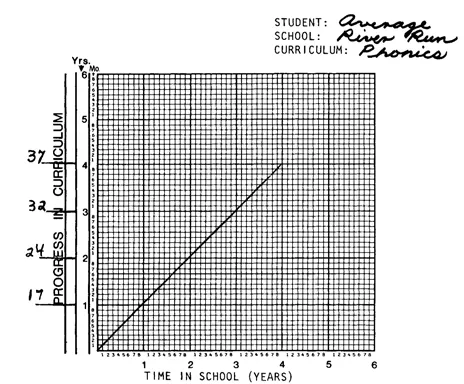
FIGURE C-2.Progress Graph for Average Students for 4-Year Phonics Sequence. River Run School. From Data-Based Program Modification: A Manual (p. 80) by Stanley Deno and Phyliss Mirkin, 1977 by the Leadership Training Institute/Special Education, University of Minnesota. Reprinted by permission.
2. Determining Actual Progress of Target Student
Against the measure of desired, or typical progress, the referred student’s mastery level is charted. To do so, an informal classroom inventory is constructed and used to assess the pupil’s progress in the curriculum area in question. The procedure can be used for any academic subject.
In reading, the examiner could, for example, choose three or more selections at random from each third of each book in the basal series. Comprehension questions are written for each selection, and the comprehension questions should reflect the types of questions asked at that grade level for assessment of comprehension. Procedures for conducting informal reading inventories can be utilized (see, e.g., Moran, 1978, pp. 41–71, any remedial reading text, or chapter 5); sometimes the basal reading series includes an informal reading inventory. Deno and Mirkin (1977) suggest using Starlin and Starlin’s (1974) guidelines for establishing reading levels (these are somewhat different from the ones provided by Gickling & Havertape, 1982), which are presented in table 5–1 in chapter 5.
Math skill progress could be assessed in a similar way, based on math series used. However, it is also possible to use a progress measure based on a skills sequence, since math is usually taught from that perspective. To begin, the examiner should prepare three sets of at least 25 problems in each skill-sequence category, each set containing five problems from the target category and one from each preceding category. The child is presented with three sets of problems from the category that represents the level in which the child would be if he or she were making average progress. The data collected are the total number of correct and incorrect digits written for each minute. (Each mark the child makes is counted, including the mark made to indicate carrying. Recording each movement/ minute, based on the work of precision teachers, is done to decrease the risk of treating all problems as of equal complexity and length. Given that problems differ in length of time needed for completion due to variations in number of required operations and digits in the answer, this method is seen as more accurate.)
For each set of problems, the correct and incorrect number of responses are ordered from high to low, and medians constructed. It is the median measure of correct/incorrect rate per minute that represents progress in math. These median rates are then compared to criteria established for mastery, frustration, and instructional levels. While local norms probably need to be established, Table C-l presents the criteria developed in one school system.
TABLE C-1
Normative Data for CBA in Reading by Grade Level
Normative Data for CBA in Reading by Grade Level
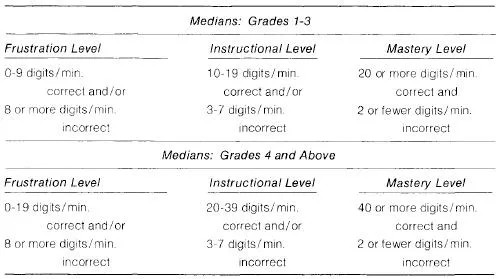
Note. From Deno and Mirkin (1977) pp. 89–90.
In each case, after mastery levels for target and average students have been established, they are plotted on the progress graph. There is now a clear picture of how the child would progress over time, compared to his or her peers, if there were no intervention.
3. Determining Desired Academic Performance for Target Student
Performance measures provide information on the child’s mastery of a particular task. Again, level of task mastery is related to median student performance in that school or class. The focus is no longer on the child’s place in the scope and sequence, but on evaluating baseline and change in the child’s level of mastery of a particular skill.
The first step is selection of the task itself on which mastery is to be established. While the task must lend itself to being counted reliably, it must also be an objective that the student must learn in order to succeed in the curriculum. No matter which area the task is in (number of math problems computed correctly/span of time; number of letters spelled correctly in sequence/ minute; or number of letters written/ minute), the desired performance is based on classroom skills that are to be mastered in order for the child to make adequate progress through the school curriculum.
Again, norms must be established to determine what desired performance for the skill could be. A random group of 8 to 10 students should be selected, based on the teacher’s evaluation of the students as average in performance of this skill. A timed sample of performance of these students on the objective of interest is then obtained. The data are summarized and arranged so that a median can be obtained to serve as the measure of desired performance for that task in that classroom. The performance should be graphed.
4. Determining Actual Performance of Target Student
Once the criterion for performance has been established in step 3, the target child’s functioning on the task is assessed using the same procedure. Frequency and accuracy are recorded on at least three samples of performance, using three different sets of materials. Again, the data are recorded, and a median score determined. The results are plotted on the same graph as the desired performance level, so that a visual picture of the discrepancy between the child’s performance and the performance of his or her average classmates can be assessed.
5. Computing Discrepancy Ratios
The final step, should this be desired for making decisions about whether to intervene or to make a determination about placement eligibility (see Deno & Mirkin, 1977, for further discussion of the use of this method for determining special education eligibility), is to compute a discrepancy ratio between desired and actual level. To determine the rate at which the student is making progress compared to other children in the school in mastering the curriculum, divide the larger of the progress levels by the smaller. For example, if the desired mastery level for beginning third grade is completion of Book G, or 18 months of progress, and the child is only reading on page 60 in Book C, which represents 4 months of progress, the equation would be:
The child in this case is progressing at a rate 4.5X less than desired for average pupils of his or her age and grade. In the time it takes the child to master one month of work, his peers are mastering four and one-half months of work.
The same equation is computed for performance. Again, the larger performance level is divided by the small one. If the median score of children in the referred child’s grade is 20 math facts/ minute, and the referred child’s performance is 10 facts/ minute, the ratio is 2.0X; that is, the child writes answers to math facts at a rate 2X less than average for his age and grade. A discrepancy ratio worksheet is used to organize the data, and the question of whether there is a discrepancy between desired and actual performance can be answered using the data. The decision then needs to be made about where intervention should be started.
1(This section is largely based on the model of Deno & Mirkin, 1977)
PART II
Note:...
Table of contents
- Cover
- Half Title
- SCHOOL PSYCHOLOGY
- Title Page
- Copyright Page
- Table of Contents
- PREFACE
- ACKNOWLEDGMENTS
- Section I Introduction
- Section II Problem Identification and Analysis
- Section III Instructional Intervention—Planning and Implementation
- Section IV The Termination Stage
- APPENDIX A: COMMUNICATION SKILLS
- APPENDIX B: REFERRAL INTERVIEW TRANSCRIPT
- APPENDIX C: (PART I)
- (PART II)
- REFERENCES
- AUTHOR INDEX
- SUBJECT INDEX
Frequently asked questions
Yes, you can cancel anytime from the Subscription tab in your account settings on the Perlego website. Your subscription will stay active until the end of your current billing period. Learn how to cancel your subscription
No, books cannot be downloaded as external files, such as PDFs, for use outside of Perlego. However, you can download books within the Perlego app for offline reading on mobile or tablet. Learn how to download books offline
Perlego offers two plans: Essential and Complete
- Essential is ideal for learners and professionals who enjoy exploring a wide range of subjects. Access the Essential Library with 800,000+ trusted titles and best-sellers across business, personal growth, and the humanities. Includes unlimited reading time and Standard Read Aloud voice.
- Complete: Perfect for advanced learners and researchers needing full, unrestricted access. Unlock 1.5M+ books across hundreds of subjects, including academic and specialized titles. The Complete Plan also includes advanced features like Premium Read Aloud and Research Assistant.
We are an online textbook subscription service, where you can get access to an entire online library for less than the price of a single book per month. With over 1.5 million books across 990+ topics, we’ve got you covered! Learn about our mission
Look out for the read-aloud symbol on your next book to see if you can listen to it. The read-aloud tool reads text aloud for you, highlighting the text as it is being read. You can pause it, speed it up and slow it down. Learn more about Read Aloud
Yes! You can use the Perlego app on both iOS and Android devices to read anytime, anywhere — even offline. Perfect for commutes or when you’re on the go.
Please note we cannot support devices running on iOS 13 and Android 7 or earlier. Learn more about using the app
Please note we cannot support devices running on iOS 13 and Android 7 or earlier. Learn more about using the app
Yes, you can access Instructional Consultation by Sylvia Rosenfield in PDF and/or ePUB format, as well as other popular books in Education & Education General. We have over 1.5 million books available in our catalogue for you to explore.