The latest edition of International Economics improves and builds upon the popular features of previous editions. The graphs, tables and statistics are all updated and improved sections have also been added on the following topics:
* New developments in international trade agreements and the latest round of international trade talks
* International financial crises
* A new section on current controversies in the international monetary system
With impressive pedagogy, learning objectives and summaries, this clearly written book will be another winner with students of international economics and business.
- 544 pages
- English
- ePUB (mobile friendly)
- Available on iOS & Android
eBook - ePub
International Economics sixth edition
About this book
Trusted by 375,005 students
Access to over 1.5 million titles for a fair monthly price.
Study more efficiently using our study tools.
Information
Subtopic
Business GeneralIndex
Economics1 Introduction
Learning objectives
By the end of this chapter you should be able to understand:
- the extent to which international trade in goods and services and international capital flows have increased more rapidly than output over the past several decades for the world as a whole;
- why barriers to the free flow of goods, labor, and capital are central to the study of international trade;
- why separate currencies and national business cycles are central to the study of international finance;
- how information about international economic events is available from a variety of sources, including the Internet.
Although world trade shrank in 2001 as a result of economic recession in the largest economies, a general characteristic of the entire post-World War II period has been a remarkable expansion of trade. In fact, global trade and investment has grown much more rapidly than output. The process of globalization has left ever fewer countries isolated or unaffected by worldwide economic conditions outside their own borders. While some protest the destruction of traditional ways of life and the challenge to national sovereignty caused by greater trade and investment, others note that trade and investment have been engines of growth that allow rising standards of living.
What explains this expansion of global commerce? Tariffs have fallen substantially. Latin American countries that in the past avoided multilateral trade organizations such as the General Agreement on Tariffs and Trade (GATT) have become members, a signal of their commitment to a different approach to trade. Former communist states and many countries in the developing world whose previous goal was to be self-sufficient have become active traders. Transportation and communication costs have continued to fall, making it less expensive to reach foreign markets. Consumer incomes have risen, and correspondingly, their demand for variety and foreign goods has risen. Rapid technical change generates new products whose innovators aggressively seek new markets. Multinational corporations, rather than produce complete products in a single plant or country, have located stages of the production process where the inputs necessary at that stage are cheaper. Many host countries now seek out rather than penalize such investment. These are just some of the reasons that the globalization process shows no sign of reaching a plateau.
Yet, this process is not proceeding at the same pace everywhere. The figures in Table 1.1 suggest why this trend has been particularly newsworthy in the United States. Trade in goods and services as a share of national output more than doubled in the past 30 years, from 11 percent in 1970 to 26 percent in 2000. Perhaps the US rate of increase appears large because the country started from a small initial base. In the case of Canada, however, in spite of the fact that the country was much more reliant on trade in 1970, the increase in its trade/output ratio from 43 percent to 86 percent represents an even bigger change in the share of the economy attributable to trade. For most European economies, a similar expansion of trade occurs. Surprisingly, the Japanese figure has changed little. Does this signify an advantage to Japan as being less subject to external shocks, or does it represent a lost opportunity to gain from the type of trade enjoyed by other advanced nations? We hope succeeding chapters provide insights into the various questions raised in this introductory chapter.
Other important trends also appear in these figures. For developing countries such as Korea and Malaysia that have relied upon export-led growth in recent decades, the ratio of trade to national output is higher than for other developing countries, and it has grown over the past 30 years. We might initially puzzle over the figures for Malaysia, which show a trade to output ratio that exceeds 100 percent. The explanation rests on the rapid rise of imports of intermediate goods that are assembled into products for export; while the output term in the denominator depends upon the income generated in the process of assembling goods, the trade term in the numerator includes the value of inputs produced elsewhere, and that has increased even more quickly.
Prior to 1991 India pursued a strategy of import substitution, based on the goal of becoming self-sufficient and avoiding dependence on a few primary exports. The larger the country, the more feasible the goal, and the figures in Table 1.1 suggest that some countries have held trade to a comparatively small share of their economies. Has this turned out to be a strategy that has effectively protected those economies from major swings in economic fortunes, and has it required any sacrifice in how rapidly their standard of living grows?
Table 1.1 Exports plus imports of goods and services as a share of GNP (percentage)
Countries such as Mexico have faced major financial crises over this period and have changed policies. These changes were not simply political pronouncements that were easily reversed. Rather, Mexican trade liberalization during the 1980s shows up in a rapid increase in the role of trade from 26 percent in 1985 to 64 percent in 2000. More gradual liberalization, as in the case of China, still demonstrates a pattern substantially different from that of India.
These trends are noteworthy, but we should not automatically conclude that this experience represents a major aberration compared to the past. Figure 1.1 shows UK experience over a longer period, tracing out the ratio of imports plus exports of goods to GDP from 1850 to 1990. Current figures do not represent a peak, but rather a return to a degree of openness that existed prior to the devastating effects of depression and war. The pattern for the United States is similar, but the increase in trade since 1970 has been even more marked. The expansion of the post-war period is significant, but the view that in earlier times economies were more sheltered from the outside influence of trade is simply inaccurate.
The composition of trade, however, has changed. At the start of the post-war period, agricultural trade fell and manufactures rose as a share of total trade. Those trends have continued at a slower pace over the past 25 years. A more recent phenomenon has been the expansion of trade in services, such as banking, insurance, telecommunications, transportation, tourism, education and health care; they have grown faster than trade in goods. That change has not had a uniform effect across countries, either. Even within the three largest developed economies, a different picture emerges. For example, between 1985 and 1997 the United States’ net exports of services rose by $74 billion, while its net imports of goods rose by $77 billion. Conversely, over that same period, Japan’s net exports of goods rose by $37 billion while its net imports of services rose by $44 billion. In the case of Germany, net exports of goods rose by $64 billion and net imports of services rose by $34 billion. While all three countries may seem similar because they are net exporters of hightechnology products and their producers often compete against each other in international markets, the pattern of trade in goods versus services should serve as a warning against any presumption that industrialized countries as a bloc have identical production patterns and trading interests.
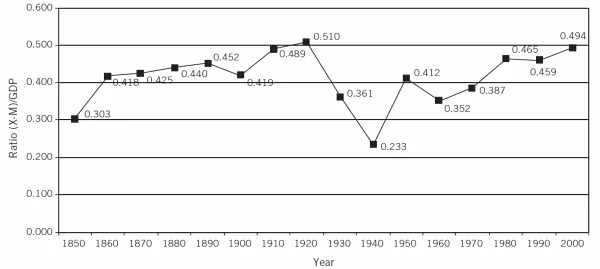
Figure 1.1 Trade in goods as a share of GDP in the United Kingdom 1850–1990.
Source: B.R. Mitchell, International Historical Statistics, Europe 1750–199...
Table of contents
- Cover Page
- Title Page
- Copyright Page
- Figures
- Tables
- Boxes
- Exhibits
- Preface
- 1 Introduction
- Part One: International trade and trade policy
- Part Two: International finance and open economy macroeconomics
- Glossary
Frequently asked questions
Yes, you can cancel anytime from the Subscription tab in your account settings on the Perlego website. Your subscription will stay active until the end of your current billing period. Learn how to cancel your subscription
No, books cannot be downloaded as external files, such as PDFs, for use outside of Perlego. However, you can download books within the Perlego app for offline reading on mobile or tablet. Learn how to download books offline
Perlego offers two plans: Essential and Complete
- Essential is ideal for learners and professionals who enjoy exploring a wide range of subjects. Access the Essential Library with 800,000+ trusted titles and best-sellers across business, personal growth, and the humanities. Includes unlimited reading time and Standard Read Aloud voice.
- Complete: Perfect for advanced learners and researchers needing full, unrestricted access. Unlock 1.5M+ books across hundreds of subjects, including academic and specialized titles. The Complete Plan also includes advanced features like Premium Read Aloud and Research Assistant.
We are an online textbook subscription service, where you can get access to an entire online library for less than the price of a single book per month. With over 1.5 million books across 990+ topics, we’ve got you covered! Learn about our mission
Look out for the read-aloud symbol on your next book to see if you can listen to it. The read-aloud tool reads text aloud for you, highlighting the text as it is being read. You can pause it, speed it up and slow it down. Learn more about Read Aloud
Yes! You can use the Perlego app on both iOS and Android devices to read anytime, anywhere — even offline. Perfect for commutes or when you’re on the go.
Please note we cannot support devices running on iOS 13 and Android 7 or earlier. Learn more about using the app
Please note we cannot support devices running on iOS 13 and Android 7 or earlier. Learn more about using the app
Yes, you can access International Economics sixth edition by Robert M. Dunn,John H. Mutti in PDF and/or ePUB format, as well as other popular books in Economics & Business General. We have over 1.5 million books available in our catalogue for you to explore.