This study reviews how West African deforestation is represented and the evidence which informs deforestation orthodoxy. On a country by country basis (covering Sierra Leone, Liberia, Cote D'Ivoire, Ghana, Togo and Benin), and using historical and social anthropological evidence the authors evaluate this orthodox critically. Reframing Deforestation suggests that the scale of deforestation wrought by West African farmers during the twentieth century has been vastly exaggerated. The authors argue that global analyses have unfairly stigmatised West Africa and obscured its more sustainable, even landscape-enriching practices.
Stessing that dominant policy approaches in forestry and conservation require major rethinking worldwide, Reframing Deforestation illustrates that more realistic assessments of forest cover change, and more respectful attention to local knowledge and practices, are necessary bases for effective and appropriate environmental policies.
eBook - ePub
Reframing Deforestation
Global Analyses and Local Realities: Studies in West Africa
- 264 pages
- English
- ePUB (mobile friendly)
- Available on iOS & Android
eBook - ePub
Reframing Deforestation
Global Analyses and Local Realities: Studies in West Africa
About this book
Trusted by 375,005 students
Access to over 1.5 million titles for a fair monthly price.
Study more efficiently using our study tools.
Information
Subtopic
EcologyIndex
Biological Sciences1
Forests of Statistics
Deforestation in West Africa
Droughts in West Africa over the last 20 years may have been caused by the destruction of rainforests in countries such as Nigeria, Ghana and Côte d’Ivoire…. Further deforestation in the region could cause the complete collapse of the West African monsoon…. At the beginning of this century, the West African coastal forests covered around 500,000 square kilometers. Since then, up to 90 per cent have disappeared to make way for farms and other kinds of human activity.
(Pearce 1997:15; see Zheng and Eltahir 1997)
Deforestation Figures and their Uses
According to analysis current in international conservation and forestry circles, West Africa has experienced dramatic forest loss during the twentieth century, accelerating during the last few decades. Ample statistics appear to bear this out, with region-wide figures—such as van Rompaey arguing that only 20 per cent of the pre-colonial forest area remained by the mid-1980s—apparently supported by those for particular countries. ‘Lost Forests’, as the New Scientist article cited above was headlined, might ‘Leave West Africa Dry’ (Pearce 1997:15; see Zheng and Eltahir 1997).
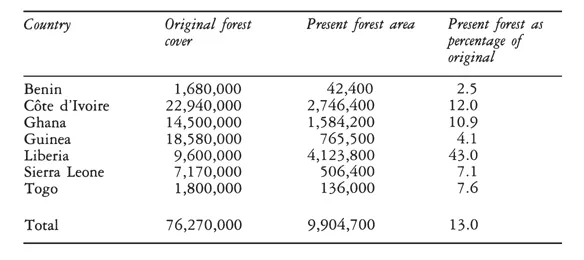
Table 1.1 presents the recent FAO figures concerning the nature, extent and rate of forest loss over the decade timescale (1980–90), showing the relentless demise of remaining forest area with more than 10 per cent lost over the decade. Table 1.2 presents the data from an influential survey of anthropogenic vegetation change in West Africa during the twentieth century (Gornitz and NASA 1985), showing countries to have lost between 69 per cent and 96 per cent of the forest area which they had at the turn of the century; a loss graphically illustrated in Map 1.1. Table 1.3 presents the most recent statement concerning the extent of present forest in relation to the ‘original forest’ (Balmford and Leader-Williams in Sayer et al. 1992:74), showing that except in Liberia, less than 13 per cent of the original forest cover remains. ‘Original forest’ is calculated with reference to the vegetation map of White shown in the Introduction (Map I.1), incorporating all the forest-savanna mosaic of the Guinea-Congolia/Sudania transition zone as ‘ex-forest’.
Table 1.1 Forest cover change 1980–90 in West African countries according to FAO (1993)
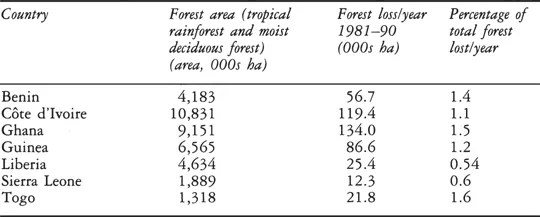
Table 1.2 Anthropogenic deforestation during the present century (Gornitz and NASA 1985)
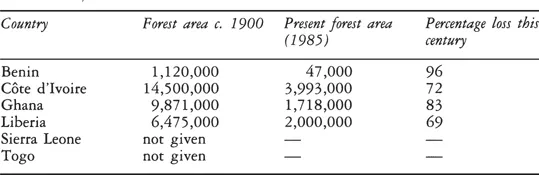
Table 1.3 Present forest cover in relation to ‘original’ forest cover according to Sayer et al. (1992)
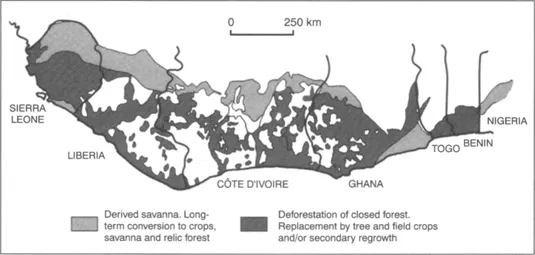
Map 1.1 Schematic map of anthropogenic vegetation changes in West Africa during the last century as described by Gornitz and NASA (1985).
Such figures circulate widely in international organisations, where they are put to a variety of uses. They inform assessments of the extent of deforestation, important to the elaboration of international agreements as well as influencing the funding agendas of donor agencies and international conservation organisations. Equally the figures are central to the analysis of the regional and global consequences of deforestation, whether concerning biodiversity loss or global climate change. They can be fundamental in assessments of the causes of deforestation, when correlated with supposed causal variables, such as population growth and economic development. In each domain, the figures and assessments made on the basis of them are crucial to the formulation of the policies of international organisations such as the World Bank, the European Union (EU), the World Conservation Union (IUCN) and the World Wide Fund for Nature (WWF).
While as we shall see, national forest assessments have an ambiguous relationship with the figures in international circulation, in many circumstances government departments and non-governmental organisations are not averse to drawing on international figures when justifying funding for forest and conservation programmes, especially in front of international donors. Indeed, in drawing on national figures which feature in global tables, national assessments can perversely acquire greater authority and rhetorical weight. In particular, as Grainger notes, ‘FAO’s forest resource statistics are usually regarded as authoritative and so quickly become established in the literature by default’ (1996:73). Indeed, in the global literature they have been seen as a significant advance on earlier assessments (Dixon et al. 1994). Furthermore, data from FAO, the World Resources Institute and other organisations are often the basis for unsourced tables and figures in secondary and tertiary articles and reports.
Assorted figures concerning deforestation have been incorporated into the scientific analysis informing international environmental agreements. The Inter-governmental Panel on Climate Change (IPCC), for instance, in assessing global carbon flux as related to tropical forests, relies heavily on the figures of FAO (1993), both directly and via other analyses which also draw on these figures (Brown 1993a; Brown et al. 1996; Dixon et al. 1994). The Global Environmental Facility, the World Bank funding envelope for combating biodiversity loss, also makes use of them. In particular, these figures are used in the construction of models which assess and predict global environmental change. Gornitz and NASA (1985), for instance, carried out their survey of twentieth-century deforestation specifically to identify albedo changes relevant to regional and global climate modelling (Henderson-Sellers and Gornitz 1984). Houghton (1991) and others argue that deforestation CO2 emissions account for around 30 per cent of all anthropogenic emissions, a proportion that is growing quickly. During the 1980s forest-burning emissions expanded by 75 per cent, out of proportion to fossil fuel combustion. In the context of biodiversity, deforestation figures have been incorporated into models of rates of species extinction by using the species-area curves of MacArthur and Wilson (1967) (e.g. Raven 1987; Myers 1988; Wilson 1989).
Cross-country statistics concerning deforestation are also used in the analysis of causes of forest loss. By correlating country-by-country deforestation rates with other national variables such as poverty, income growth, external indebtedness, interest rates, land market values or structural adjustment, analysts attempt to identify the causal significance of each of these (e.g. Brown and Pearce 1994; Hyde et al. 1996). Indeed, as the discipline of environmental economics has gained strength, so international deforestation figures have increasingly been relied on to explore these economic variables as underlying causes. Similar methods are used to explore the impact of population growth, densities and agricultural land clearance (e.g. Allen and Barnes 1985; Burgess 1992). Others factors which are hard to explore using multi-country statistics—such as agricultural incentive policies, trade policies, and timber royalty and concession policies which underprice timber—have been explored in other ways, often based on single country cases, but which nevertheless depend on good figures concerning deforestation (see Repetto 1988, 1990; Barnes 1990; Sharma and Rowe 1992).
Environmental economics provides only the latest, and most model dependent, in a long line of social science analyses of deforestation causes. Many are less amenable to quantified assessment, but are nevertheless interlinked with a view of deforestation as recent and rapid, helping to explain it. With shifting cultivation usually seen as the key proximate cause, issues such as immigration into forest areas, poverty and tenure insecurity are highlighted in such analyses. Socio-economic and political changes over the past century, which may have compromised once effective ‘traditional’ systems of resource use and management, are seen as contributing to deforestation over the period; effects only further accentuated by population growth. The significance of these issues to analysts’ views of modern rural society is clearly magnified, the more dramatic the deforestation with which they are linked. In this way, forestry and social science analyses can be seen to frame each other. This is exemplified in a recent World Bank overview of deforestation in West and Central Africa which argued that:
[T]raditional farming and livestock husbandry practices, traditional dependency on wood for energy and for building material, traditional land tenure arrangements and traditional burdens on rural women worked well when population densities were low and population grew slowly. With the shock of extremely rapid population growth…these practices could not evolve fast enough. Thus they became the major source of forest destruction and degradation of the rural environment.
(Cleaver 1992:67)
Assumptions about the causes of deforestation have often been formalised in models designed to predict future deforestation rates and trends. IDIOM, for example, a model developed in the framework of the Tropenbos programme (Jepma 1995), was devised to simulate the effect of various policy options on deforestation rates, on the basis of changes in the global economy, timber supply and demand, and changes in agricultural land use. A second model, GEOMOD (Hall et al. 1995), is also designed to simulate rates and patterns of land use change, using spatial preferences in land colonisation (along rivers, up rivers and upslope) and preferences for adjacency and dispersion, considered on a region-by-region basis, to predict rates and patterns of tropical land use change. Supposed linkages between population growth and land cover change have formed the basis of numerous models predicting deforestation rates and associated carbon emissions (e.g. Houghton et al. 1993). For such models, deforestation figures are important for constructing the parameters of the model and calibrating them.
But as this work explores, those using data are often unaware of their basis and potential inaccuracy. Others have reservations about data quality, and acknowledge the need for more accurate assessments of forest cover change (e.g. Brown and Pearce 1994; Brown et al. 1996), but nevertheless use and recycle what is available. In this book the critical assessment of forest cover change in the humid forest region of West Africa can be taken as a test case, which may have more global relevance. It shows the extent of error inherent in these statistics, and the kind of dynamics to which improved assessments would need to pay attention.
The Basis of Forestry Statistics
On what basis are assertions of the extent, timing and speed of deforestation made? The rest of this chapter considers some of the methods and deductions which have been most influential in generating the type of statistics employed in these assorted analyses. By outlining the forms of evidence and lines of argument which have guided analysis of deforestation to date, we highlight areas where they might be open to question, and hence avenues for their critique. This provides a broader perspective that contextualises our detailed country-by-country studies, which develop these critiques in relation to specific situations. Following the country-by-country critiques, and the questions they pose to such deforestation figures, we examine the history of these methods and their policy implications in relationship with colonial and modern institutions.
Observations at many scales and within many disciplines are implicated in the analysis of deforestation. Here it is convenient to begin with some of the key issues in the way international figures are derived. We move on to consider ways in which the national-level statistics which frequently inform international estimates are obtained, and then the ways that on-the-ground observations—and their interpretation within theories dominant in forest ecology—have been used to suggest deforestation. Many of the statistics of forest cover found in international conservationist literature are clearly borrowed from other reports of the same genre, thus circulating without returning to original sources. While many examples of this circulation are provided in later chapters, here we reflect on the bases from which original sources derive their estimates. We begin, however, with some definitional issues: how ‘forest’ is defined clearly affects estimates of change, and much forest can be lost or gained in the translation between different definitions. In approaching deforestation at different scales of analysis, very different definitions of forest are brought into play. It is partly in the interplay of such definitions that the critiques in later chapters find their foothold.
International and National Forest Interpretation
Definitional Discrepancies in Forestry Analysis
Different perspectives on tropical forests lead to very different definitions of deforestation. It has become conventional to distinguish between restricted environmentalist definitions of forest, and more inclusive ‘economistic’ definitions (Barraclough and Ghimire 1990, 1995; Jepma 1995). Environmentalists, ecologists and conservation agencies such as WWF, IUCN and the World Conservation Monitoring Centre (Sayer et al. 1992) consider the impact of excessive logging, wood gathering, fire and livestock grazing as deforestation, degrading the forest ecosystem through loss of biomass and ecosystem services. Those defining forests in terms of economic forestry, such as FAO (1981), Lanly (1982) and the World Resources Institute (WRI), by contrast, tend to consider such processes as degradation, but not as deforestation unless they result in total conversion of forest to other land uses (see also Grainger 1993:46). This more inclusive definition is exemplified in FAO, which defines forests as ‘ecosystems with a minimum of [only] 10% crown cover of trees…generally associated with wild flora, fauna and natural soil conditions, and not subject to agricultural practices’ (our emphasis) (1993:10).
More restricted definitions of forest clearly give much lower estimates of forest area, and higher estimates of deforestation both in area (as logging can count as deforestation) and in percentage per annum (as it is relative to a smaller area).
Nevertheless, this broad definitional distinction cannot account, in West Africa, for the massive discrepancies between certain forest cover estimates; discrepancies which rest on inconsistent categorisation of forest types. FAO (1993), for example, suggests that in 1990 there was more ‘forest’ in Ghana than the area Ghanaian scholars consider to lie within the forest zone. This is equally true for Benin and Togo. This discrepancy is accounted for by the way FAO (1993) has defined ‘moist deciduous forest’. The category includes not only vegetation usually considered in West Africa as tropical moist forest (i.e. moist evergreen forest, semi-deciduous forest) but also large tracts of Guinean savanna, usually classified as open savanna woodland, which fulfil the >10 per cent canopy cover criterion. Thus the FAO (1993) categorisation does not, infact, resolve the difference between forest and savanna (see Grainger 1996).
In contrast with FAO, analyses made in particular West African countries, as we will see, tend to adopt definitions of forest which exclude savanna and more closely parallel the more restricted definitions of ecologists and environmentalists. This type of definition is exemplified in Ghana by Hall (1987:33), who defines forest as ‘Vegetation dominated by trees, without a grassy or weedy under-story, and which has not recently been farmed’. Forest thus defined is readily distinguishable from savannas which contain grasses. More subtle distinctions nevertheless exist within this genre of definition, based on a host of criteria, whether related to bioclimatic zone (as we discuss below) or to variations in canopy density. As we shall see, choice of criterion is frequently pragmatic, determined by the methods of cover assessment (i.e. satellite spectral resolutions, air photograph interpretation techniques), and this can lead to important discrepancies between assessments. Unless fine definitional distinctions are taken into account, especially when comparing cover estimates over short time intervals, trends in forest cover can be grossly misrepresented. Such discrepancies are best discussed in their specific contexts, and thus await analysis in the country chapters.
While FAO (1993:10) infers that the land it classifies as forest is ‘not subject to agricultural practices’, the definition remains ambiguous in certain respects: whether various types of home gardening and tree cropping which leave high forest trees among tree crops are to be defined as forest, as well as the point at which fallow in regeneration comes to be classified as forest. The only way to account for the massive forest cover areas which the recent FAO figures present is, in fact, to assume that in practice areas of fallow and tree crops have been included. In this, FAO estimates again conflict with the way forest is usually defined within the countries in question to exclude land under recent fallow and tree crops. Unfortunately, as the FAO (1993) data have neither ecological nor policy relevance to West Africa, then, we have had largely to ignore them in our country-by-country analyses.
Remotely Sensed Imagery
With the growing availability of satellite data, it is often assumed that international figures for forest cover change—at least over the 1–2 decade timescale for which such data are available—are based on time series comparison of these. Indeed, many assumed that the assessment for FAO (1993) would be derived in this way. Instead, the FAO’s analysis of forest cover change between 1980 and 1990 relied principally on previous national assessments. Only some of these were based on remote sensing data. Furthermore, the average survey year was 1980, and to create from these an estimate for both 1980 and 1990, forest areas usually measured only once (in 35 out of 40 African countries) were massaged using a mathematical model which explicitly linked national forest cover decline to rising population density. This not only depends upon assumptions about the relationship between population and forest cover change and about population history which we shall have cause to question, but also deflects uncertainty from statistics on vegetation cover to statistics on demographic change, which, many would argue, are even more notoriously suspect.
Even where time series satellite or air photographic data are available, they may not, in fact, provide the unproblematic source of accurate data on forest cover change which they first appear to. For any given moment in time, image resolution strongly influences what types of vegetation can be discerned, leading, almost by default, to forest being defined in certain ways. For instance, it is questionable whether satellite images and air photographs at a scale of 1:40,000 or smaller can resolve the distinction b...
Table of contents
- Cover
- Half Title
- Title Page
- Copyright
- Dedication
- Contents
- List of maps
- List of tables
- Acknowledgements
- Introduction
- 1. Forests of statistics: deforestation in West Africa
- 2. Côte d’Ivoire
- 3. Liberia
- 4. Ghana
- 5. Benin
- 6. Togo
- 7. Sierra Leone
- 8. Statistics, policy and power
- 9. Reframing forest history, reframing forest policy
- Bibliography
- Index
Frequently asked questions
Yes, you can cancel anytime from the Subscription tab in your account settings on the Perlego website. Your subscription will stay active until the end of your current billing period. Learn how to cancel your subscription
No, books cannot be downloaded as external files, such as PDFs, for use outside of Perlego. However, you can download books within the Perlego app for offline reading on mobile or tablet. Learn how to download books offline
Perlego offers two plans: Essential and Complete
- Essential is ideal for learners and professionals who enjoy exploring a wide range of subjects. Access the Essential Library with 800,000+ trusted titles and best-sellers across business, personal growth, and the humanities. Includes unlimited reading time and Standard Read Aloud voice.
- Complete: Perfect for advanced learners and researchers needing full, unrestricted access. Unlock 1.5M+ books across hundreds of subjects, including academic and specialized titles. The Complete Plan also includes advanced features like Premium Read Aloud and Research Assistant.
We are an online textbook subscription service, where you can get access to an entire online library for less than the price of a single book per month. With over 1.5 million books across 990+ topics, we’ve got you covered! Learn about our mission
Look out for the read-aloud symbol on your next book to see if you can listen to it. The read-aloud tool reads text aloud for you, highlighting the text as it is being read. You can pause it, speed it up and slow it down. Learn more about Read Aloud
Yes! You can use the Perlego app on both iOS and Android devices to read anytime, anywhere — even offline. Perfect for commutes or when you’re on the go.
Please note we cannot support devices running on iOS 13 and Android 7 or earlier. Learn more about using the app
Please note we cannot support devices running on iOS 13 and Android 7 or earlier. Learn more about using the app
Yes, you can access Reframing Deforestation by James Fairhead,Melissa Leach in PDF and/or ePUB format, as well as other popular books in Biological Sciences & Ecology. We have over 1.5 million books available in our catalogue for you to explore.