Categorical and Nonparametric Data Analysis
Choosing the Best Statistical Technique
- 506 pages
- English
- ePUB (mobile friendly)
- Available on iOS & Android
Categorical and Nonparametric Data Analysis
Choosing the Best Statistical Technique
About this book
Featuring in-depth coverage of categorical and nonparametric statistics, this book provides a conceptual framework for choosing the most appropriate type of test in various research scenarios. Class tested at the University of Nevada, the book's clear explanations of the underlying assumptions, computer simulations, and Exploring the Concept boxes help reduce reader anxiety. Problems inspired by actual studies provide meaningful illustrations of the techniques. The underlying assumptions of each test and the factors that impact validity and statistical power are reviewed so readers can explain their assumptions and how tests work in future publications. Numerous examples from psychology, education, and other social sciences demonstrate varied applications of the material. Basic statistics and probability are reviewed for those who need a refresher. Mathematical derivations are placed in optional appendices for those interested in this detailed coverage.
Highlights include the following:
- Unique coverage of categorical and nonparametric statistics better prepares readers to select the best technique for their particular research project; however, some chapters can be omitted entirely if preferred.
- Step-by-step examples of each test help readers see how the material is applied in a variety of disciplines.
- Although the book can be used with any program, examples of how to use the tests in SPSS and Excel foster conceptual understanding.
- Exploring the Concept boxes integrated throughout prompt students to review key material and draw links between the concepts to deepen understanding.
- Problems in each chapter help readers test their understanding of the material.
- Emphasis on selecting tests that maximize power helps readers avoid "marginally" significant results.
- Website (www.routledge.com/9781138787827) features datasets for the book's examples and problems, and for the instructor, PowerPoint slides, sample syllabi, answers to the even-numbered problems, and Excel data sets for lecture purposes.
Intended for individual or combined graduate or advanced undergraduate courses in categorical and nonparametric data analysis, cross-classified data analysis, advanced statistics and/or quantitative techniques taught in psychology, education, human development, sociology, political science, and other social and life sciences, the book also appeals to researchers in these disciplines. The nonparametric chapters can be deleted if preferred. Prerequisites include knowledge of t tests and ANOVA.
Frequently asked questions
- Essential is ideal for learners and professionals who enjoy exploring a wide range of subjects. Access the Essential Library with 800,000+ trusted titles and best-sellers across business, personal growth, and the humanities. Includes unlimited reading time and Standard Read Aloud voice.
- Complete: Perfect for advanced learners and researchers needing full, unrestricted access. Unlock 1.4M+ books across hundreds of subjects, including academic and specialized titles. The Complete Plan also includes advanced features like Premium Read Aloud and Research Assistant.
Please note we cannot support devices running on iOS 13 and Android 7 or earlier. Learn more about using the app.
Information
Chapter 1
Levels of Measurement, Probability, and the Binomial Formula
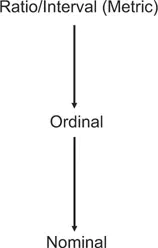
Levels of Measurement
Probability
The Meaning of Probabil...
Table of contents
- Cover
- Title
- Copyright
- Dedication
- BRIEF CONTENTS
- CONTENTS
- Preface
- About the Author
- CHAPTER 1 Levels of Measurement, Probability, and the Binomial Formula
- CHAPTER 2 Estimation and Hypothesis Testing
- CHAPTER 3 Random Variables and Probability Distributions
- CHAPTER 4 Contingency Tables: The Chi-Square Test and Associated Effect Sizes
- CHAPTER 5 Contingency Tables: Special Situations
- CHAPTER 6 Basic Nonparametric Tests for Ordinal Data
- CHAPTER 7 Nonparametric Tests for Multiple or Related Samples
- CHAPTER 8 Advanced Rank Tests (for Interactions and Robust ANOVA)
- CHAPTER 9 Linear Regression and Generalized Linear Models
- CHAPTER 10 Binary Logistic Regression
- CHAPTER 11 Multinomial Logistic, Ordinal, and Poisson Regression
- CHAPTER 12 Log-Linear Analysis
- CHAPTER 13 General Estimating Equations
- CHAPTER 14 Estimation Procedures
- CHAPTER 15 Choosing the Best Statistical Technique
- Answers to Odd-Numbered Problems
- Index