![]()
Part 1
Contexts: Understanding the field
![]()
1 Cities in a contemporary context
Introduction
Cities operate in complex, multi-layered contexts. Such a configuration challenges our ability to imagine them and design interventions aimed at improving their performance. However, a good grasp of these contexts can significantly facilitate the task of steering the city economy. This chapter provides an overview of the five most potent processes that, in my view, affect cities: urbanization; the evolution of the capitalist world economy (including globalization); the ICT revolution; climate change; and democratization and decentralization.
Urbanization and cities
Definitions
Urbanization and cities are two intrinsically connected, but distinct phenomena. Urbanization refers to an increase in the proportion of the population residing in urban areas in total population. Thus the criteria of the urban, as opposed to the rural, play a key role here. In fact, such criteria vary a great deal between countries, ranging from administrative status, population size and density to economic structure and functional features of the settlement. However, the most frequently used criteria are administrative status on the one hand, and population size/density on the other (UN-DESA 2012a). Even within the same criterion, though, threshold requirements could differ. When population size is used as a criterion, for instance, its threshold can vary from 200 to 50,000 people (UN-DESA 2012a). Another point to note is that, at a higher level of urbanization, where people live may not reflect what they do for employment: a software engineer may choose to live in the countryside. This has led to efforts to count urban populations not in terms of where they live, but what they do. All these variations can have significant impact on the recorded level of urbanization in a country. Thus, ‘India can be said to be less than 30 per cent urban or more than 60 per cent urban, depending on the proportion of settlements with between 2,000 and 20,000 inhabitants classified as urban or rural’ (Tacoli 2003, p. 10). This discrepancy cautions against accepting any cross-country urbanization figures too readily. Notwithstanding this, the UN-DESA (2012b) finds that, as of 2011, 52 per cent of the world population were already living in urban areas, responsible for an estimated 80 per cent of the economic activities on this planet. In reality, of course, urbanization means much more than the spatial concentration of people, or occupational change. It also entails the diffusion of the system of values, attitudes and behaviour that characterize ‘urban culture’ (Castells 1977).
Cities form a subset of all urban areas. They are characterized by high density and complex forms of social, economic organization and functions. The United Nations (2014) regards the ‘city proper’ as a ‘locality defined according to legal/political boundaries and an administratively recognized urban status that is usually characterized by some form of local government’. This highlights the importance of the administrative status of the settlement in defining cities.
However, the city defined here is only the political city, not the economic city. The economic city (or the city economy) is normally larger than the political city. It refers to inter-related, concentrated economic activities in and around a city, integrated through the labour and housing markets. In fact, to follow Storper’s (1997) conceptualization of the city economy as a social economy, it ought to include not only the economic activities, but also the social relations underpinning these activities. Furthermore, the scope of integrated economic activities depends to a crucial extent on the availability and efficiency of a networked infrastructure. Therefore, broadly speaking, the city economy encompasses the integrated economic activities, the social relations and the physical infrastructure that underpin these activities and their integration.
Depending on the threshold requirement of integration, the city economy manifests itself through either the metropolitan area or the wider metropolitan region. The metropolitan area is typically characterized by a denser core and less dense peripheral areas in terms of population. For instance, in the case of the United States, in the 2002 Census, a metropolitan area included a core area with a population of at least 50,000, together with adjacent communities that are integrated, in an economic sense, with the core area. To be included as part of a metropolitan area, outlying areas must meet certain minimum thresholds (25 per cent) of commuting rate to or from the core area (O’Sullivan 2009, Chapter 1). On the other hand, the UN-DESA (2012b) defines the metropolitan region as including ‘both the contiguous territory inhabited at urban levels of residential density and additional surrounding areas of lower settlement density that are also under the direct influence of the city (e.g., through frequent transport, road linkages, commuting facilities etc.)’ (p. 7). The OECD (2006) writes:
Metropolitan regions are generally identified as large concentrations of population and economic activity that constitute functional economic areas, typically covering a number of local government authorities. An economic area in this sense denotes a geographical space within which a number of economic links are concentrated: most obviously labour markets, but also networks of firms, important parts of supply chains, and relations between firms and local authorities.
(p. 31)
Once again, it is important to recognize that there are significant differences in how metropolitan areas and regions are defined. Moreover, the differences between a metropolitan area and region are a matter of both scale and substance. On the one hand, a metropolitan region (or city-region) covers a wider area than a metropolitan area. However, there is also a substantive difference in terms of functions. While it is commuting that links up the metropolitan area, it is the mutual provision of services that underpins the metropolitan region. In the case of London, its metropolitan area includes the central city (i.e. areas covered by the Greater London Authority) and its neighbouring home counties, while the London metropolitan region covers the wider Southeast region of the United Kingdom (Llewelyn-Davies 1996).
Urbanization versus city growth
It is important to distinguish urbanization from city growth: whilst the former is a transition with an end point (i.e. urbanization level of 100 per cent), the latter could go on growing without limit. Indeed, Davis (1965) stresses that for contemporary urbanising societies, the key challenge lies in managing city growth, rather than controlling the speed of urbanization as governments tend to do.
Davis notes that, contrary to popular belief, the speed of today’s urbanization in developing countries is only slightly faster than developed countries in their heyday of urbanization: in 40 underdeveloped countries for which he had data in the decades up to the 1950s and 1960s, the average increase in the proportion of the population that was urban was 20 per cent per decade, whereas in 16 industrial countries, during the decades of their most rapid urbanization (in the nineteenth century), the average gain per decade was 15 per cent (p. 49). However, he finds that the absolute growth of urban populations in today’s underdeveloped countries was much faster than that of earlier urbanizers: in 34 underdeveloped countries for which Davis had data relating to the 1940s and 1950s, the average annual gain in urban population was 4.5 per cent, compared with 2.1 per cent in nine European countries during their period of fastest urban population growth (in the second half of the nineteenth century).
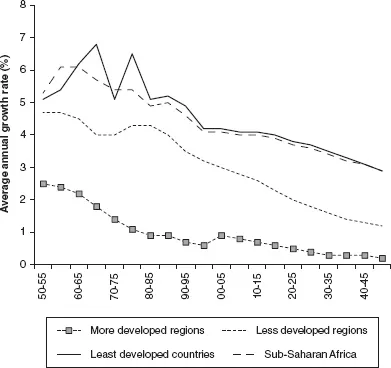
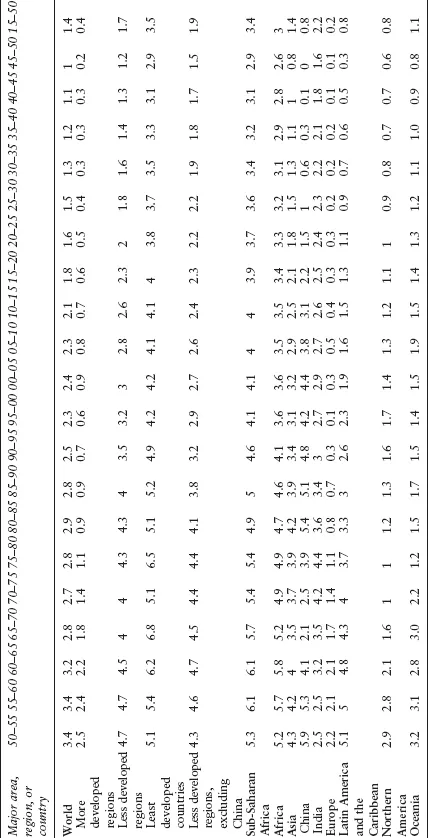
More recent statistics show that urban population growth in the 1950s, 1960s and 1970s was actually much faster than in subsequent decades across the world. Most regions had their peak growth rates by 1970 (Figure 1.1). The only exceptions were China and India: China had two peaks – 5.9 per cent per annum in 1950–55 and 5.4 per cent per annum in 1980–85 – whereas India’s peak came in 1975–80 at 4.4 per cent per annum (Table 1.1). In comparison, for the 35 years between 2015 and 2050, the urban population is projected to increase globally by only 1.4 per cent per annum on average. This projected rate is only slightly higher for less developed regions (LDRs) (1.7 per cent), but much higher for the least developed regions (LtDRs) (3.5 per cent). The rate will be 2.2 per cent for India and 3.4 per cent for Sub-Saharan Africa (SSA). By 2045–50, urban population growth will completely cease in China, but it will continue for LtDRs and SSA, at 2.9 per cent (Table 1.1).
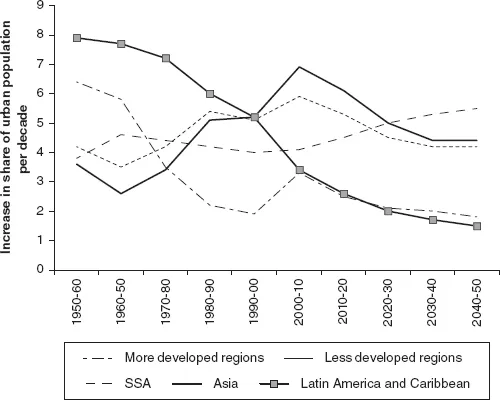
By contrast, the rates of urbanization, measured by increases in the level of urbanization, are more diverse. As Figure 1.2 shows, in the less developed world and Asia, the first decade of the twenty-first century saw the peaking of this increase: the average increase in the percentage of urban population per decade was nearly 6 per cent in the less developed world and almost 7 per cent in Asia. However, in SSA, this rate peaked in 1960–70 and reached its trough (4 per cent per decade) in the 1990s. Indeed, independent research suggests that the rate of urbanization may have been substantially over-estimated. Using satellite image data, a study from the London-based African Research Institute (2012) suggests that out of 18 selected African countries, four experienced de-urbanization in the previous decade; ten countries’ urbanization either stagnated or grew by less than 1 per cent in the first decade of the twenty-first century; and in only four countries (Kenya, Tanzania, Cameroon and Burkina Faso), there appeared to be meaningful urbanization (i.e. by more than 1 per cent in a decade), although even here there is some uncertainty. For instance, while the populations of the two largest cities in Kenya (Nairobi and Mombasa) appeared to have grown faster than the national population, eight of the eleven main established towns recorded in previous censuses grew more slowly than Kenya’s national population between 1999 and 2009. The report concludes: ‘The evidence in many countries indicates an increase in the urbanisation level of only about 1 per cent per decade’ (p. 10). This suggests that urbanization per se was stagnant in some SSA countries.
Figure 1.1 Growth of urban population in major regions.
Source: Data from UN-DESA 2012b.
Determinants of urbanization
There are three determinants of urbanization:
1 growth and reclassification of previously designated rural areas as urban;
2 faster natural population growth in urban areas compared with rural areas; and
3 rural-urban migration (Davis 1965).
Davis notes that there are major differences in the patterns of urbanization in terms of the relative contributions of the second and third factors between earlier urbanization of today’s industrial countries and the contemporary urbanization in today’s developing countries. Relating to the factor of relative urban population growth, he notes that, while early urbanization was held back by higher mortality rates in urban areas and had to drain the countryside for labour used in urban centres, this is not the case anymore. Improvements in medical services and better infrastructure have made urban areas much more liveable. As a result, developing cities have much higher natural population growth.
Table 1.1 Annual growth rate of urban population in major areas and countries
Source: UN-DESA (2012a).
Figure 1.2 Past and projected rates of urbanization.
Source: Data from UN-DESA 2012b.
In particular, Davis finds that, whilst rural-urban migration provided the dominant source of early urbanization, this was not the case in the 1940s and 1950s. For instance, general population growth and rural-urban migration provided 44 per cent and 20 per cent respectively of the growth of the urban population in Costa Rica (1927–1962); and 50 per cent and 22 per cent respectively in Mexico (1940–1960). The comparative figures were 19 per cent and 69 per cent in Switzerland (1850–1888); general population growth provided only 21 per cent of the growth in France (1846–1911).
Davis attributes the diminished role of rural-urban migration to the lack of economic development (or industrialization) in cities of underdeveloped countries. While early urbanization in today’s industrial countries effectively ‘took surplus rural manpower and put it to work producing goods and services that in turn helped to modernize agriculture’, city growth today has become ‘increasingly unhinged from economic development’.
Bairoch (1988) provides even more striking evidence of what he calls the ‘hyperurbanization’ and ‘urbanization without industrialization’ in the Third World. In particular, he explores the gap between the level of urbanization and the percentage of industrial (including manufacturing and mining) employment in total employment for today’s developed countries and the Third World at the heights of their urban growth. His analysis reveals that the gap was about 50 per cent in the first half of the nineteenth century for the developed countries, but 130 per cent for the Third World in the first half of the twentieth century.
Though more recent comparable data are lacking, there is little evidence that, with the exception of Asia, this situation has improved at all. The situation in SSA is especially dire. Evidence shows that, during 1995–2010, out of the 44 countries examined, only 12 countries managed to increase the share of manufacturing in their GDP. In comparison, 18 countries increase...