- 456 pages
- English
- ePUB (mobile friendly)
- Available on iOS & Android
eBook - ePub
Mastering Statistical Process Control
About this book
Mastering Statistical Process Control shows how to understand business or process performance more clearly and more effectively. This practical book is based on a rich and varied selection of case studies from across industry and commerce, including material from the manufacturing, extractive and service sectors. It will enable readers to understand how SPC can be used to maximum effect, and will deliver more effective monitoring, control and improvement in systems, processes and management.
The common obstacle to successful use of SPC is getting bogged down with control charts, forgetting that visual representation of data is but a tool and not an end in itself. Mastering SPC demonstrates how statistical tools are applied and used in reality. This is a book that will open up the power of SPC for many: managers, quality professionals, engineers and analysts, as well as students, will welcome the clarity and explanation that it brings to understanding the use and benefit of SPC in a wide range of engineering, production and service situations.
Key case studies include using SPC to:
· Measure quality and human factors
· Monitor process performance accurately over long periods
· Develop best-practice benchmarks using control charts
· Maximise profitability of fixed assets
· Improve customer service and satisfaction
Trusted by 375,005 students
Access to over 1.5 million titles for a fair monthly price.
Study more efficiently using our study tools.
PART 1
An Introduction to the Theory of SPC
The aim of any type of data analysis is to gain understanding from data. When we collect process performance data we see that it varies. The information in this variation is important to the understanding of how the process is performing and statistical process control (SPC) is primarily the tool for understanding variation:
• SPC is the use of statistically based tools and techniques principally for the management and improvement of processes. The main tool associated with SPC is the control chart.
• A control chart is a plot of a process characteristic, usually through time with statistically determined limits. When used for process monitoring, it helps the user to determine the appropriate type of action to take on the process.
You may find these two definitions off-putting, and the purpose of this part of the book is to explain them, and also the basic concepts and ideas behind SPC as well as the importance and use of control charts.
First we explain, briefly, what is meant by the term ‘process’ as it is important to understand how the term is used in the book.
One of the crucial keys to understanding performance measurement, and hence statistical process control, is variation. If there were no variation there would be no problem: life would be much simpler and more boring. Much of a manager’s work is given over to understanding, managing and controlling variation. This whole book deals with the analysis, understanding and management of variation.
Unfortunately statistics does come into SPC. Actually, statistics should come into all aspects of running an organisation because statistics is all about understanding data. There are only a few main statistical measures that need to be discussed here, namely the mean, the standard deviation and the range. You do not need to know the formula for these, but for those interested in doing so, the formulae are included.
Appreciating the existence of variation and something of the statistics for measuring it are building blocks. The next step is to realise the implications of variation for the understanding and management of processes. It is important to fully grasp the concepts outlined here, and particularly those on over-control (tampering).
So much for explaining the problems of variation and its impact on processes; the key tool for understanding variation is the control chart; therefore, we have summarised what a control chart is and how to use it.
Experience has shown that there are many popularly held erroneous beliefs about SPC. Unfortunately they have limited the application of this powerful tool. In the next section we dispel some of these myths, and by implication explain some of the many uses for SPC. If you have any pre-conceived ideas about SPC, or wonder if SPC is applicable to you, do read this section.
Finally, there have been many useful management tools, methodologies and philosophies aimed at management over the years. Each one has brought its benefits and left its mark. The current methodology that is being successfully implemented in many organisations is “Six Sigma”. Like all the previous ones, Six Sigma does bring benefits, but it is not a panacea, and neither is SPC! However, each does have its place, application and use, and we summarise the use of Six Sigma briefly in anticipation of a later chapter devoted to it.
1 Statistical process control
A word on processes …
As statistical process control (SPC) is used for analysing process data, it is pertinent to explain what we mean by a process. There are many good definitions of a process. One very simple definition with a wide application is:
A process is everything required to turn an input into an output for a customer.
This definition can be applied to a spectrum of processes, from small tasks (such as filling in a form) to a complete business system (such as order fulfilment). Processes may involve just one person at one end of the spectrum to complete departments including suppliers at the other. The concept can be applied to the design, development and manufacturing of goods and/or services, such as patient care, government or legal processes.
Let us consider this definition in a little more detail. We start with an “input”, for example, a raw material, a sick patient or a blank form, and we “do something” with it to produce an output – a finished product, a “well” person or a completed form. The “something” which we “do” to turn the input into the output is the process. We need “things” to carry out the process. These “things” can be grouped into: equipment, people, materials, procedures and environment. For a hospital, the “people” include the nursing, administration and other staff as well as any contractors; equipment includes beds, monitors, testing equipment; procedures are the (usually documented) steps that the people follow to do the job; “materials” include medication and dressings; and “the environment” includes both the physical environment (such as temperature) and more abstract aspects (such as culture) (see Figure 1.1).
Clearly there must be a customer for the process, and the customer may be internal or external to the organisation.
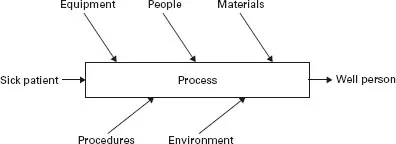
Figure 1.1 A process: everything required to turn an input into an output for a customer
… And a word on variation
All the (non-trivial) process outputs, inputs, methods of working, etc. vary. This is where many management problems begin. For example:
• The time taken to process invoices, treat a patient, answer an enquiry, etc. will vary from occasion to occasion.
• The number of safety/breakdown/interrupt incidents in a time period will vary.
• Performance of different work groups, departments and people will vary.
• The performance of a particular work group, department or person will vary over time.
Sometimes this variation may be considered relatively unimportant, such as variations in the amount of light transmitted through a pane of ordinary window glass. Other instances of variation, for example flight arrival times, may be much more serious.
As SPC is fundamentally about understanding and managing variation, we need to spend some time considering some key aspects of it. As a focus for this discussion, see Figure 1.2.
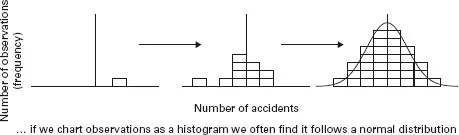
Figure 1.2 Observations vary from one another, and build into a distribution
Suppose we measure some attribute of a process on a regular basis. For example, it may be the number of accidents per month. When we have taken our first observation we could plot the value on a histogram, as shown in Figure 1.2. The next observation is likely to be different. As we continue taking and plotting observations we would gradually see the distribution of observations take on a pattern. Frequently this distribution will take the shape of the bell curve, known by statisticians as the normal distribution (see Figure 1.3).
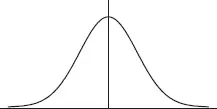
Figure 1.3 The normal distribution
Distributions vary in one or more of three ways (Figure 1.4):
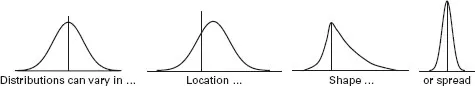
Figure 1.4 Distributions can vary in only three ways
• the central location (i.e. a “typical” value);
• the shape (e.g. one peak or two, symmetrical or skewed);
• the spread or variability (how different the values are: e.g. the span from the maximum to the minimum).
We use the “normal” distribution as the basis for discussions throughout as it is the most common distribution that we are likely to come across. However, the ideas, methods and charts that we discuss were developed by Shewhart not because of the statistical theory but because they worked in practical situations. More recent analysis has shown that these ideas work for many different distribution shapes, such as those in Figure 1.5.
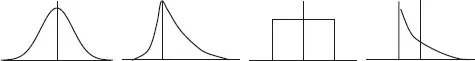
Figure 1.5 In practice, control charts work with many different shapes of distribution … including these
Some statistical measures
There are a few statistical terms relating to location and variation that are used when discussing SPC. The calculations are given at this point for reference only and it is not necessary to understand the calculations in order to understand SPC and control charts.
When collecting data, statisticians refer to the first value collected as x1, the second as x2, the ith as xi and the last value, called the nth as xn.
As an example, we use the following set of data values (e.g. these values could be the number of patients admitted each shift for the last nine shifts): 3, 6, 5, 6, 4, 7, 2, 6, 4.
For this set of values n = 9 and x1 = 3, x2 = 6, etc., and xn, that is x9 = 4.
There are two main descriptions that we ...
Table of contents
- Cover
- Halftitle
- Title
- Copyright
- Contents
- List of Figures
- List of Charts
- List of Case Studies and Examples
- Reference of Charts
- Preface
- Acknowledgements
- Introduction
- Part 1 An Introduction to the Theory of SPC
- Part 2 Exploding Data Analysis Myths
- Part 3 Putting SPC into Practice – The Cases
- Part 4 Implementing and Using SPC
- Part 5 Developing SPC Skills: Organisational Review Questions, Workshops and Exercises
- Part 6 An Introduction to Six Sigma Luis Miguel Giménez
- Bibliography, references and other resources
- Experimental Resources
- Appendix A
- Glossary of terms and symbols
- Index
Frequently asked questions
Yes, you can cancel anytime from the Subscription tab in your account settings on the Perlego website. Your subscription will stay active until the end of your current billing period. Learn how to cancel your subscription
No, books cannot be downloaded as external files, such as PDFs, for use outside of Perlego. However, you can download books within the Perlego app for offline reading on mobile or tablet. Learn how to download books offline
Perlego offers two plans: Essential and Complete
- Essential is ideal for learners and professionals who enjoy exploring a wide range of subjects. Access the Essential Library with 800,000+ trusted titles and best-sellers across business, personal growth, and the humanities. Includes unlimited reading time and Standard Read Aloud voice.
- Complete: Perfect for advanced learners and researchers needing full, unrestricted access. Unlock 1.5M+ books across hundreds of subjects, including academic and specialized titles. The Complete Plan also includes advanced features like Premium Read Aloud and Research Assistant.
We are an online textbook subscription service, where you can get access to an entire online library for less than the price of a single book per month. With over 1.5 million books across 990+ topics, we’ve got you covered! Learn about our mission
Look out for the read-aloud symbol on your next book to see if you can listen to it. The read-aloud tool reads text aloud for you, highlighting the text as it is being read. You can pause it, speed it up and slow it down. Learn more about Read Aloud
Yes! You can use the Perlego app on both iOS and Android devices to read anytime, anywhere — even offline. Perfect for commutes or when you’re on the go.
Please note we cannot support devices running on iOS 13 and Android 7 or earlier. Learn more about using the app
Please note we cannot support devices running on iOS 13 and Android 7 or earlier. Learn more about using the app
Yes, you can access Mastering Statistical Process Control by Tim Stapenhurst in PDF and/or ePUB format, as well as other popular books in Business & Operations. We have over 1.5 million books available in our catalogue for you to explore.