Climates and Weather Explained is a comprehensive introduction to the study of the atmosphere integrating climatology and meteorology. Clear explanations of basic principles, concepts and processes are supported by a wealth of highly informative illustrations and a vast array of case studies demonstrating the relevance of weather and climate to everyday life. Focusing particularly on the Southern hemisphere the authors provide fresh insights into topical environmental concerns from global warming and natural hazards to sustainable global population.
The textbook is supplemented by a unique interactive Student CD-ROM containing entirely additional material, for practical work and more advanced study. Closely related to each chapter of the book, the Student CD-ROM features:
* Over 170 extra 'Notes', 40 illustrations and tables.
* Multiple choice, self-assessment and practical exercises.
* Extended glossary and key word searching * Hypertext presentation and extensive cross-referencing
* A gallery of meteorological photographs in full colour
A special Instructors' Resource Pack is also available containing an additional Instuctors'CD-ROM. For further information visit: website address here
- 464 pages
- English
- ePUB (mobile friendly)
- Available on iOS & Android
eBook - ePub
Climates and Weather Explained
About this book
Trusted by 375,005 students
Access to over 1.5 million titles for a fair monthly price.
Study more efficiently using our study tools.
Information
Part I
AIR
1
THE ATMOSPHERE
1.1 INTRODUCTION
The title of this book implies two questions—what do we mean by ‘weather’ and ‘climate’, and how do we account for them? As regards definitions, ‘weather’ concerns the conditions prevailing during a particular few hours over a specified area which is perhaps 30 km across, whilst ‘climate’ is the atmospheric character of such an area, shown by records over thirty years or so. We are especially interested in the weather and climate near the surface, i.e. temperature, radiation, humidity, rainfall and wind. The difference between weather and climate is that the latter is the aggregate or composite of the weather. It involves the extremes and variability of the weather as well as average values: floods and droughts at a place do not create a good climate overall. However, any brief definition of climate needs to be greatly expanded to be satisfactory.
The short answer to the second question is that various atmospheric processes and surface features explain the weather, and that in turn explains the climate. Surface features include the latitude, elevation, landform, orientation to the Sun and distance from the sea. Whether the surface is ocean, vegetated, ice, desert or densely populated is also important. The meteorological processes are numerous and interrelated, but can be grouped for convenience into four categories—(i) those concerning the air’s composition and structure, (ii) those involving the Sun’s energy, (iii) processes related to the transformations of water from liquid to vapour, cloud, rain and snow, and (iv) winds. These are dealt with respectively in Parts I to IV of the book.
Processes that affect the weather operate on various scales, from the microscopic scale of the formation of cloud droplets (discussed in Chapter 8) to the size of the Earth, e.g. the winds discussed in Chapter 12. This range of spatial scales applies to climates too (Table 1.1). For example, we can talk about changes of the Earth’s climate, or the climate of Australia, or differences between the climates of Wellington and Santiago, or those of the front and back gardens of a house. The climate of each these domains is influenced by the climate of the next largest, shown in Table 1.1, and also by the conditions actually within the domain. So, for instance, a garden’s microclimate is affected, firstly, by the suburb’s topoclimate (i.e. the overall climate of the locality, determined by its elevation, nearness to the coast, etc.), and, secondly, by the site, e.g. the garden’s wetness, shelter and slope towards the Sun.
Table 1.1 Scales of climate
In what follows, we shall consider examples of various scales of time and distance, with especial attention to the southern hemisphere, which consists largely of water (Note 1.A). We begin with the largest space, the atmosphere as a whole, and the span of time since the Earth began.
1.2 ORIGIN OF THE ATMOSPHERE
The Earth’s present atmosphere is unique. The Moon and the planet Mercury are airless, whilst Venus and Mars have atmospheres consisting almost entirely of carbon dioxide (Table 1.2). Even our own air was quite different in the earliest part of the Earth’s history, as we shall see.
History
Present evidence suggests that the Earth was formed about 4,500 million years ago (i.e. 4.5 giga-years before the present, written as 4.5 GaBP), and a transient primary atmosphere formed at the same time, consisting mostly of water vapour. That condensed to form the oceans at about 3.3 GaBP, and then the present secondary atmosphere arose, initially from gases released by ‘outgassing’, as the more volatile materials boiled off from the heavier components of the Earth’s molten interior, escaping through fissures in the embryonic crust or, latterly, by way of volcanoes. Volcanic gases may consist of 80 per cent water vapour, 12 per cent carbon dioxide, 6 per cent sulphur dioxide, for instance, with small amounts of other gases but no free oxygen. The original lack of the oxygen which now comprises just over a fifth of today’s suface air, and makes our present atmosphere so distinctive amongst planets, is demonstrated by rocks with greygreen unoxidised iron sulphide, until 1.9 GaBP. Significant amounts of oxygen subsequently are indicated by abundant rocks coloured brown or red by oxidized iron. Thereafter the amount of oxygen increased, as indicated in Figure 1.1.
Table 1.2 Comparison of the climates of three planets
It remains uncertain how free oxygen first came about. There were probably several mechanisms. One involves photolysis, the splitting of molecules of the volcanic water vapour by solar radiation, thus forming separate hydrogen and oxygen atoms. Hydrogen is light and relatively mobile, and so escaped from the Earth’s gravity into space, whilst the oxygen remained. That oxygen would absorb precisely the radiation responsible for its formation by photolysis, so that less and less could form. Such an automatic limitation of further oxygen creation is sometimes called the Urey effect. It would result in an oxygen concentration less than 0.3 per cent of present levels, unless there were other processes creating oxygen.
Further creation depended on photosynthesis, which occurs in some bacteria and in the leaves of plants (Note 1.B). It is the basic process of plant life and involves the combination of carbon dioxide, water and sunlight energy, to form oxygen and kinds of carbohydrate, the buildingblock of plant tissue. Photosynthesis within blue-green algae may have occurred from 3 GaBP, and green-plant photosynthesis from about 2 GaBP. The outcome was an oxygen concentration of about 1 per cent of that now, by 1.6 GaBP. Until that time, most of the oxygen released by photosynthesis was captured by unoxidised iron and dissolved in the sea.
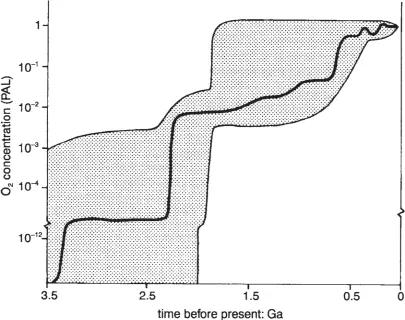
Figure 1.1 Estimates of the maximum and minimum possible concentrations of oxygen at various times, as a fraction of the PAL. PAL stands for ‘present atmospheric level’. The bold line is a suggested best estimate.
The creation of oxygen accelerated with the evolution of plant respiration (Note 1.B), allowing increasingly complicated vegetation, suited to a wider range of environments. The increased area of plants raised oxygen concentrations rapidly, to about 10 per cent of present levels by 1 GaBP (Figure 1.1).
Initially, the lack of oxygen meant that the Sun’s sterilising ultra-violet radiation (see Chapter 2) could reach to ground level, preventing the development of any life in exposed situations. As a consequence, life forms could exist only under at least 10 metres of water. Subsequently, life in ever shallower depths became possible as the concentration of atmospheric oxygen rose and protected the living tissue. The shallowness allowed better access to the air’s carbon dioxide, needed for photosynthesis, and so yet more oxygen formed. In fact, the atmosphere appears to have had enough oxygen to allow life on land by 0.4 GaBP. As a result, another rapid acceleration of the evolutionary process took place, with an increase of oxygen to present levels by maybe 0.3 GaBP, i.e. 300 million years ago.
Plant Life
Plants and the atmosphere have greatly affected each other, and still do. For example, fire would destroy most vegetation if the oxygen content of the atmosphere were to increase from the present 20 per cent to be as high as 25 per cent. Then the reduced plant-life would result in decreased oxygen production, restoring the status quo. Conversely, if the oxygen concentration went down because of more carbon dioxide, the latter increase would accelerate photosynthesis, increasing the vegetation and hence oxygen creation, so that once again the status quo would be reestablished. In other words, the oxygen concentration appears to be held steady by the vegetation, automatically.
The interaction of vegetation and climate can be considered in terms of the Gaia hypothesis, first advanced by James Lovelock in 1972. He regarded the climate as part of a self-regulating global system, called Gaia, after a Greek Earthgoddess. The system includes living things and the environment, and these evolve in mutual interaction, in a way that appears to optimize conditions for living things. However, any regulatory ability of Gaia is now challenged by human activities such as air pollution, soil erosion, fossil-fuel burning, damming rivers, deforestation, acid rain and damage to the ozone layer. Most of these are discussed later in the book.
1.3 COMPOSITION OF AIR
Air is a mixture of various gases added together. It also contains water vapour, dust and droplets, in quantities which vary with time, location and altitude.
Samples collected by balloon as early as 1784 showed the uniformity of air’s composition up to 3 km. Later measurements have confirmed that the air up to 80 km or so consists chiefly of nitrogen and oxygen in almost constant proportions, forming a well-mixed layer called the homosphere, within which only the amount of water vapour and ozone vary. But the ratio of oxygen to nitrogen at 300 km is twelve times what it is at sea-level. Beyond about 600 km there is a preponderance of helium and then hydrogen, the lightest gas. Gases at those heights exist mostly as isolated atoms, rather than molecules of linked atoms.
If the components of a litre of surface air were separated, 0.781 litres (i.e. 781 millilitres, 781 mL or 78.1 per cent by volume) would be occupied by nitrogen, a colourless, tasteless, odourless gas. The proportion is slightly lower if masses are considered instead of volumes, because the densities of nitrogen and oxygen differ (Table 1.3). Volume proportions are usually of more importance, in practice.
Table 1.3 The proportions of dry air within the homosphere taken up by component gases, apart from traces of other gases such as neon, helium, krypton, hydrogen and xenon, which are mostly inactive chemically
In addition to the gases shown in Table 1.3, air near the ground holds substantial amounts of water vapour according to location and season. At the equator there may be 2.6 per cent by volume of water vapour, while colder air (e.g. at 70 degrees latitude or on high mountains) might have less than 0.2 per cent. (This is explained in Chapter 4 and discussed further in Chapter 6.) Incidentally, the density of water vapour is less than that of nitrogen, and therefore less than that of air as a whole (Note 1.C).
Carbon Dioxide
Only about one molecule out of each 3,000 or so molecules of air consists of carbon dioxide. That is much less than on nearby planets (Table 1.2). Despite its small concentration, it is important because of the effects of carbon dioxide on photosynthesis and on global temperatures (Chapter 2), and the fact that the concentration is increasing. Analysis of bubbles of air trapped in Antarctic ice down to 2 km depth suggests that there were about 200 parts per million by volume (ppmv), 160,000 years ago. This increased to 270 ppm by 130,000 BP, falling to 210 ppm again by 18,000 BP, when the last Ice Age was at its most extreme (Chapter 15). There was a subsequent global warming and around 10,000 BP the concentration had risen to 275 ppm, where it remained until the middle of the nineteenth century, prior to industrialisation. It is now over 350 ppm and increasing at an accelerating rate (Figure 1.2), so that 600 ppm may well be exceeded in the next century (Chapter 15). The atmosphere already holds about 2.7 million million tonn...
Table of contents
- Cover Page
- Title Page
- Copyright Page
- Table of Contents
- Preface
- Part I Air
- Part II Energy
- Part III Water
- Part IV Winds
- Part V Climates
- Part VI Supplements
- Plates
- Figures
- Tables
- Notes
- Abbreviations
- Bibliography
Frequently asked questions
Yes, you can cancel anytime from the Subscription tab in your account settings on the Perlego website. Your subscription will stay active until the end of your current billing period. Learn how to cancel your subscription
No, books cannot be downloaded as external files, such as PDFs, for use outside of Perlego. However, you can download books within the Perlego app for offline reading on mobile or tablet. Learn how to download books offline
Perlego offers two plans: Essential and Complete
- Essential is ideal for learners and professionals who enjoy exploring a wide range of subjects. Access the Essential Library with 800,000+ trusted titles and best-sellers across business, personal growth, and the humanities. Includes unlimited reading time and Standard Read Aloud voice.
- Complete: Perfect for advanced learners and researchers needing full, unrestricted access. Unlock 1.5M+ books across hundreds of subjects, including academic and specialized titles. The Complete Plan also includes advanced features like Premium Read Aloud and Research Assistant.
We are an online textbook subscription service, where you can get access to an entire online library for less than the price of a single book per month. With over 1.5 million books across 990+ topics, we’ve got you covered! Learn about our mission
Look out for the read-aloud symbol on your next book to see if you can listen to it. The read-aloud tool reads text aloud for you, highlighting the text as it is being read. You can pause it, speed it up and slow it down. Learn more about Read Aloud
Yes! You can use the Perlego app on both iOS and Android devices to read anytime, anywhere — even offline. Perfect for commutes or when you’re on the go.
Please note we cannot support devices running on iOS 13 and Android 7 or earlier. Learn more about using the app
Please note we cannot support devices running on iOS 13 and Android 7 or earlier. Learn more about using the app
Yes, you can access Climates and Weather Explained by Bart Geerts,Edward Linacre in PDF and/or ePUB format, as well as other popular books in Technology & Engineering & Environmental Science. We have over 1.5 million books available in our catalogue for you to explore.