Foundatioins of Business Economics explains microeconomic analysis in terms of real business situations. The underlying theme of the book is the way in which markets link together interdependent activities and how they confront and solve problems of information. The book covers a wide range of issues, including
*The economic way of thinking
*The Business environment
*Product markets
*Market failure
*Factor markets
*General equilibrium
Theory is developed carefully but with a light touch and mathematics kept to a minimum, making the book easily accessible. It will be particularly valuable for those students whose interests lie on the human side of industry. explanation of microeconomic analysis in terms of real business practice. The author examines the way markets link together interdependent economic activities and provides general equilibrium models of the entire economic system.
- 224 pages
- English
- ePUB (mobile friendly)
- Available on iOS & Android
eBook - ePub
About this book
Trusted by 375,005 students
Access to over 1.5 million titles for a fair monthly price.
Study more efficiently using our study tools.
Information
Subtopic
Economic TheoryIndex
EconomicsPart I
INTRODUCTION
1
THE ECONOMIC WAY OF THINKING
1 INTRODUCTION
The Economist Bookshop, the biggest London shop specialising in social and political sciences, was for many years jointly owned by The Economist newspaper and the London School of Economics (LSE). Its board of directors were therefore not short of economic expertise. The Academic Board of LSE objected to the way secondhand books were confined to a narrow set of shelves at the back of the shop, arguing that the second-hand trade should be expanded, mainly for the benefit of students with limited means but also for the profitability of the shop as a whole. The manageress, a very determined lady, was not impressed. She claimed that second-hand books reduced sales of new books. Who was right?
Common sense and fixed quantities
Common sense is on the side of the manageress. Second-hand books are substitutes for new ones, and the more you sell of the first the less you will sell of the other: students take so many courses per year and need so many books, no more and no less. This idea that we need readily countable quantities of goods, so many books per year, and in the wider world, so many tons of wheat, yards of cloth, barrels of oil and so on, is widely held. It lies behind arguments that home suppliers are bound to suffer from foreign competition, that the way to cure unemployment is to share a fixed quantity of work, that what is good for one must be bad for another. It is quite foreign to the economic way of thinking.
Systematic relationships between variables
Quantities of goods bought and sold are not fixed in amount but variables, quantities that vary in a systematic way with changes in underlying determinants. Thus members of the Academic Board advocating expansion of second-hand sales urged, first, that the quantity of new books sold per year varies with the price of new books, the lower the price the greater the quantity sold. The possibility of reselling books after use reduces the effective price of a new book. If a book costing £12 new could be resold secondhand after one year for £4, its use for one year would cost £8 instead of £12. At an effective price of £8 a greater number of new books would be purchased.
Secondly, they argued that this relationship between the effective price of new books and the numbers sold would be affected by a number of surrounding circumstances. In particular, the number bought at any price would be smaller the cheaper the available substitutes. Second-hand books are substitutes for new ones, so an increase in the supply of second-hand books would of itself reduce the quantity of new books purchased at any price. They argued that the extension of sales of new books consequent on the reduction in effective price (in our example, from £12 to £8) would more than offset the fall in quantities of new books sold at any price (£12, £8 or whatever).
Economic arguments depend upon theory and fact. The answer to the bookshop’s problem evidently depends upon the strength of the two relationships of, first, quantities bought at alternative prices and, secondly, quantities bought and the availability of substitutes. This is typical of the economic way of thinking. It specifies the relationships to consider, particular outcomes depending upon the magnitudes involved. The facts have to be established in each particular case. Economic theory shows what facts to look for.
This way of thinking is an improvement on common sense which easily mistakes surface appearance for insight. In the case of the bookshop, premises were continuously extended and additional space provided for both new and second-hand books. Sales of new books expanded along with sales of second-hand books. This does not prove that second-hand sales are good for the new-book trade: even more new books might have been sold if second-hand books had not been available; but the historical record provides no refutation.1
Careful account of the possibilities of substitution lies behind a good deal of economic analysis. Section 2 considers the possibility of substituting one input for another in the production of a single product. Section 3 is devoted to the substitution of one product for another by changing the disposition of factors of production. Increasing production of one good at the expense of another leads to the concept of economic cost being opportunity cost, the cost of one line of action being the value of the most desirable alternative forgone. Section 4 is devoted to opportunity cost, and Section 5 to the ways in which opportunity cost may differ from accounting cost.
2 SUBSTITUTING INPUTS IN PRODUCTION
Cud-chewing cattle have a simple digestive system that is able to extract or synthesise all nutrients needed from a diet of starch, protein and roughage.2 The daily requirements of a 500 kg bullock growing at a rate of 0.5 kg per day has been estimated to be 4.0 kg of starch equivalent (SE), 0.5 kg of protein equivalent (PE), and 0.5 kg fibre. These may be provided by a variety of feedstuffs; but suppose, for simplicity, that there are only two possibilities, dried grass and barley. The percentages of starch, protein and fibre in dried grass and barley are roughly: 8 kg of dried grass, 5.7 kg of barley or some proportionate combination of the two would therefore supply all the starch required; 5 kg of dried grass, 7.1 kg of barley or some proportionate combination would supply the protein; and 2.5 kg of dried grass, 10 kg of barley or some proportionate combination would supply the fibre. Combinations of dried grass and barley which would be sufficient for all nutrients are depicted in Figure 1.1.
See Table
Combinations of grass and barley on or to the right of AB would provide sufficient starch; combinations on or to the right of CD would provide sufficient protein; and combinations on or to the right of EF would provide sufficient fibre. The segmented curve AGHF shows the smallest amounts of dried grass that may be combined with increasing amounts of barley, or vice versa, the smallest amounts of barley that may be combined with increasing amounts of dried grass, whilst maintaining an adequate diet. Curves such as AGHF which show alternative ways of producing a given level of product are termed equalproduct curves, or isoquants. AGHF is an isoquant for producing 0.5 kg liveweight beef per day with one bullock. Providing we add a bullock each time, the isoquant for 1 kg beef per day would be twice the distance from the origin, starting at 16 kg dried grass and ending at 20 kg barley; the isoquant for 1.5 kg beef would be three times as far from the origin, and so on. A set of isoquants, or isoquant map, provides a means of depicting the technological possibilities.
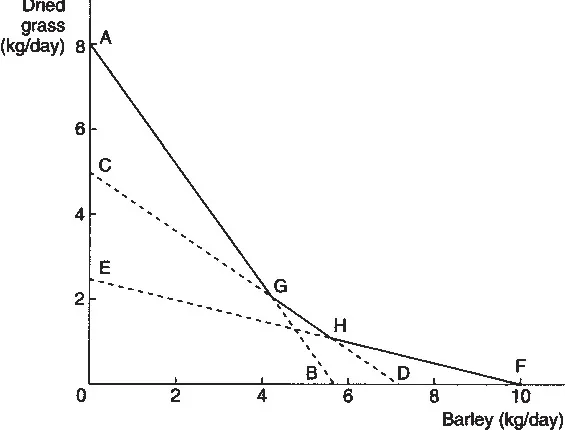
Figure 1.1 Feeeding bullocks
Between A and G, 1 kg of barley may be substituted for 1.4 kg of dried grass. If substitution is continued beyond G, a kilogram of barley will only replace 0.7 kg of grass because the lower protein content of barley becomes critical. The rate of substitution of 1 kg barley for 0.7 grass continues until H is reached. Between H and F, 1 kg of barley is only sufficient to offset the loss of 0.25 kg of grass because barley is such a poor provider of fibre. The marginal rate of substitution of barley for grass thus diminishes along the isoquant. This is a general property of isoquants reflecting the imperfect substitutability of different inputs for one another.
Isoquants show that technology alone is not sufficient to decide the least-cost method of production. There are almost always a large number of technological possibilities and choosing between them depends upon the prices of inputs. If dried grass sold for 12p per kilo and barley for 10p, producing beef using only dried grass (as at A) would cost 96p per 0.5 kg of beef, using the combination of inputs at G would cost 67p, at H 69p, and at F 100p. The leastcost method of producing beef would be to feed the combination shown at G.
Combinations of inputs as at G are said to be efficient. Efficiency is defined, following Vilfredo Pareto, as a situation where it is impossible to make any change that would make someone better-off without making anyone worse-off. Isoquants draw attention to two sources of inefficiency in production. It is easy to waste inputs. In our example this would be shown as producing 0.5 kg of beef with a combination of grass and barley lying to the right of AGHF. This is termed technological inefficiency, or ‘X-inefficiency’, and is shown by the range of costs experienced by firms using similar methods of production. Secondly, a firm may avoid technological inefficiency by choosing inputs located on an isoquant, but choose the wrong combination, such as H instead of G. This is termed ‘economic inefficiency’.
Grass and barley may be used to produce things other than beef. The barley, for instance, might be malted. However, these inputs will not be pursued further. Instead, the possibilities of substituting one product for another are examined in terms of icecream.
3 SUBSTITUTING ONE PRODUCT FOR ANOTHER
Consider an ice-cream parlour that has daily supplies of 60 kg milk, 51 kg ice-cream powder, and 30 kg sugar, which may be converted into soft ice-cream or conventional ice-cream. Recipes for making 1 kg of each type are as follows:
See Table
If all the milk is used for soft ice-cream, there is enough for 100 kg. If it is all used for conventional ice-cream, there is enough for 200 kg; or milk may be shared between the two types, each reduction of 1 kg soft ice-cream releasing sufficient milk for 2 kg conventional ice-cream.
So far as ice-cream powder is concerned, there is enough for 340 kg soft, 102 kg conventional or some combination of the two. For instance, if powder needed for 100 kg soft – 15 kg powder – is released for conventional ice-cream it is sufficient for 30 kg conventional, and, so far as powder is concerned, a possible combination is 240 kg soft plus 30 kg conventional.
There is still need to take account of the third ingredient, sugar. Enough sugar is provided for 120 kg soft or 150 kg conventional, or for some combination of the two. Reducing production of soft ice-cream by 4 kg releases enough sugar to make 5 kg conventional.
Looking at each ingredient successively, however, does not give a full picture of the production possibilities because each type of ice-cream requires all three ingredients. The full picture is provided by Figure 1.2. The limit to output imposed by the supply of milk is shown by the dotted line AB; so far as milk is concerned it is possible to have 100 kg soft and no conventional (A), 200 kg conventional and no soft as at B, or any of the combinations along AB. Similarly, the limit imposed by the powder constraint is shown by CD, and that imposed by the sugar constraint by EF. When account is taken of all three ingredients at the same time, we are left with the area bounded by the origin and the three constraints OAGHD. Any combination of soft and conventional ice-cream falling within this area is attainable, and the maximum amount of conventional that can be produced together with a given amount of soft, and vice versa, is shown by the curve AGHD.
Starting at A, where only soft ice-cream is produced, it may be seen that switching ingredients from soft to conventional provides a relatively large amount of conventional ice-cream, 2 kg, for every kilogram of soft given up. This is because at A there is surplus sugar and powder, and the only ingredient being fully used, milk, is especially suited to conventional ice-cream. As substitution proceeds, G is reached. At this point all the milk and sugar are being employed to make the two products, and additional kilograms of conventional ice-cream can be obtained only by reducing output of soft sufficiently to release the required sugar. Conventional ice-cream needs less sugar than soft, so it is still possible to obtain 1.25 kg of conventional for every kilogram of soft given up. If substitution is carried beyond H, conditions are least favourable for substituting conventional for soft. Combinations of the two products are limited by the available powder, and reducing output of soft by 1 kg releases only 0.15 kg powder, sufficient for 0.3 kg conventional ice-cream. AGHD illustrates the diminishing rate of transformation of one product into another as substitution proceeds.
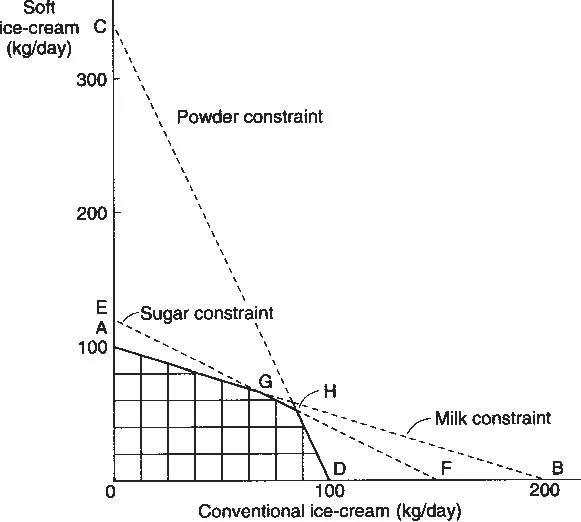
Figure 1.2 Substituting products
The frontier AGHD, showing maximum combinations of the two products that may be made with limited resources, is known as a production possibility or transformation curve. Transformation curves are typically convex upwards for the reason that explains the shape of the ice-cream curve. When substitution of one product for another begins it is possible to make use of inputs specially suited to the new product, but as substitution continues favourable conditions are exhausted.
Transformation curves illustrate two further sources of inefficiency. Choice of product combinations lying within the boundary represents technological inefficiency because it would be possible to produce more of one product without reducing the output of the other, or to increase output of both, by moving out to the boundary. Economic efficiency demands in addition that the point on the boundary be chosen that best satisfies consumer demands.
The diminishing rate of transformation of one product into another implies increasing cost of one product in terms of the other. In the ice-cream example, starting from A, a kilogram of conventional ice-cream at first only costs 0.5 kg of soft, after G 0.8 kg of soft must be given up, and beyond H 3.3 kg. The concept of cost as alternative forgone, brings us to opportunity cost.
4 OPPORTUNITY COST
An economic decision involves answering the question ‘what difference will it make?’, which breaks into two parts: ‘what will be the benefit?’ and ‘what must be given up to gain the benefit?’ What has to be given up, the most valuable alternative forgone, is the opportunity cost. There are usually lots of alternatives to any course under consideration, and the best of these alternatives is the relevant opportunity to take into account. The value of this best opportunity forgone is the opportunity cost of the decision.
Since one cannot give up an opportunity that is already past, opportunity cost is by its very nature forward looking, and, as it depends upon appraisals of the future, it is subjective. This does not mean that it is arbitrary, that reasonable men cannot agree on its estimation or agree on the way estimates will change as unexpected events unfold. It does mean, however, that past accounts only indicate opportunity cost in special circumstances.
Opportunity cost and personal decisions
The cost of reading this book is not the price that must have been paid by reader or library. The best disposition of that payment was a cost sometime in the past, but it is over and done with. Now the cost of reading is the value of the best alternative use of time.
If this reading is part of higher education, it should be clear that the cost of such education is not simply a sum of money payments related to term time. Food is necessary whether a student is at university or not, and so the cost of victuals form no part of the cost of education. On the other hand, if time were not devoted to study it might be used for earning a living. Hence, a large component in the cost of university education is income forgone by students.
This component evidently varies between individuals. The average earnings of young women exceed those of young men, and so the cost of female education is on average greater than that of male education. Older people in general earn more than younger and so the cost of education to a mature student is usually greater than to an adolescent. The greater the possible earnings of an individual the greater the cost of his education: the two years Mick Jagger, of the Rolling Stones, spent at LSE must have been amongst the most costly ever. As average earnings rise with increasing productivity so does the opportunity cost of education, and a onesided case has been made out on these lines for reducing the duration of courses.3
There is such a thing as a free lunch
Austere economists are fond of quoting Phineas T. Barnum’s dictum that ‘there is no such thing as a free lunch’. Like most folk wisdom this is not always true. If men and women are left unemployed their labour is lost forever. The cost of man-hours unused is whatever value, possibly negative, that is placed on enforced leisure: it is not the wage that would be paid with employment. One of the exasperating consequences of failure to recognise the nature of opportunity cost is the persistence of politicians arguing that projects which would provide work for the unemployed cannot be afforded because the cost would be too high. The opportunity cost of employing a man without work is near zero, whilst the cost of leaving him unemployed is the value of the output he would otherwise produce.
A less portentous example of zero opportunity cost is the use of an existing facility. In the absence of congestion the opportunity cost of an additional vehicle crossing a bridge is ze...
Table of contents
- Cover Page
- Half Title page
- Title Page
- Copyright Page
- Contents
- List of figures
- List of tables
- Preface
- Part I Introduction
- Part II The Business Environment
- Part III Product Markets
- Part IV Factor Markets
- Part V Conclusion
- Notes
- Index
Frequently asked questions
Yes, you can cancel anytime from the Subscription tab in your account settings on the Perlego website. Your subscription will stay active until the end of your current billing period. Learn how to cancel your subscription
No, books cannot be downloaded as external files, such as PDFs, for use outside of Perlego. However, you can download books within the Perlego app for offline reading on mobile or tablet. Learn how to download books offline
Perlego offers two plans: Essential and Complete
- Essential is ideal for learners and professionals who enjoy exploring a wide range of subjects. Access the Essential Library with 800,000+ trusted titles and best-sellers across business, personal growth, and the humanities. Includes unlimited reading time and Standard Read Aloud voice.
- Complete: Perfect for advanced learners and researchers needing full, unrestricted access. Unlock 1.5M+ books across hundreds of subjects, including academic and specialized titles. The Complete Plan also includes advanced features like Premium Read Aloud and Research Assistant.
We are an online textbook subscription service, where you can get access to an entire online library for less than the price of a single book per month. With over 1.5 million books across 990+ topics, we’ve got you covered! Learn about our mission
Look out for the read-aloud symbol on your next book to see if you can listen to it. The read-aloud tool reads text aloud for you, highlighting the text as it is being read. You can pause it, speed it up and slow it down. Learn more about Read Aloud
Yes! You can use the Perlego app on both iOS and Android devices to read anytime, anywhere — even offline. Perfect for commutes or when you’re on the go.
Please note we cannot support devices running on iOS 13 and Android 7 or earlier. Learn more about using the app
Please note we cannot support devices running on iOS 13 and Android 7 or earlier. Learn more about using the app
Yes, you can access Foundations of Business Economics by Harry Townsend in PDF and/or ePUB format, as well as other popular books in Economics & Economic Theory. We have over 1.5 million books available in our catalogue for you to explore.