- 294 pages
- English
- ePUB (mobile friendly)
- Available on iOS & Android
eBook - ePub
Architecture in a Climate of Change
About this book
Revised to incorporate and reflect changes and advances since it was first published the new edition of Architecture in a Climate of Change provides the latest basic principals of sustainability and the future of sustainable technology.
Including new material on wind generation, domestic water conservation, solar thermal electricity as well as international case studies Architecture in a Climate of Change encourages readers to consider new approaches to building making minimum demand on fossil based energy.
Trusted by 375,005 students
Access to over 1.5 million titles for a fair monthly price.
Study more efficiently using our study tools.
Information
Chapter One
Climate Change – Nature or Human Nature?
The key question is this: climate change is now widely accepted as being a reality, so, is it a natural process in a sequence of climate changes that have occurred over the paleoclimatic record or is it being driven by humans? If we hold to the former view then all we can hope for is to adapt as best we can to the climate disruption. On the other hand, if we accept that it is largely human induced, then it follows that we ought to be able to do something about it.
There is widespread agreement among climate scientists worldwide that the present clear evidence of climate change is 90 per cent certain to be due to human activity mainly though the burning of fossil-based energy. This should be good enough to persuade us that human action can ultimately put a brake on the progress of global warming and its climate consequences.
Once the issues are understood, a commitment to renewable energy sources and bioclimatic architectural design should become unavoidable. Inspiring that commitment is the purpose of the first part of the book which then goes on to illustrate the kind of architecture that will have to happen as part of a broader campaign to avert the apocalyptic prospect of catastrophic climate change.
The Carbon Cycle
Carbon is the key element for life on Earth. Compounds of the element form the basis of plants, animals and micro-organisms. Carbon compounds in the atmosphere play a major part in ensuring that the planet is warm enough to support its rich diversity of life.
The mechanism of the carbon cycle operates on the basis that the carbon locked in plants and animals is gradually released into the atmosphere after they die and decompose. This atmospheric carbon is then taken up by plants which convert carbon dioxide (CO2) into stems, trunks, leaves, etc. through photosynthesis. The carbon then enters the food chain as the plants are eaten by animals.
There is also a geochemical component to the cycle mainly consisting of deep ocean water and rocks. The former is estimated to contain 36 billion tonnes and the latter 75 million billion tonnes of carbon. Volcanic eruptions and the weathering of rocks release this carbon at a relatively slow rate.
Under natural conditions the release of carbon into the atmosphere is balanced by the absorption of CO2 by plants. The system is in equilibrium, or would be if it were not for human interference.
The main human activity responsible for overturning the balance of the carbon cycle is the burning of fossil fuels which adds a further 6 billion tonnes of carbon to the atmosphere over and above the natural flux each year. In addition, when forests are converted to cropland the carbon in the vegetation is oxidised through burning and decomposition. Soil cultivation and erosion add further carbon dioxide to the atmosphere.
If fossil fuels are burnt and vegetation continues to be destroyed at the present rate, the CO2 in the atmosphere will treble by 2100. Even if there is decisive action on a global scale to reduce carbon emissions, atmospheric concentrations will still double by this date.
With the present fuel mix, every kilowatt hour of electricity used in the UK releases one kilogram of CO2. The burning of one hectare of forest gives off between 300 and 700 tonnes of CO2.
These are some of the factors which account for the serious imbalance within the carbon cycle which is forcing the pace of the greenhouse effect which, in turn, is pushing up global temperatures.
The Greenhouse Effect
A variety of gases collaborate to form a canopy over the Earth which causes some solar radiation to be reflected back from the atmosphere, thus warming the Earth’s surface, hence the greenhouse analogy. The greenhouse effect is caused by long-wave radiation being reflected by the Earth back into the atmosphere and then reflected back by trace gases in the cooler upper atmosphere, thus causing additional warming of the Earth’s surface (Figure 1.1).
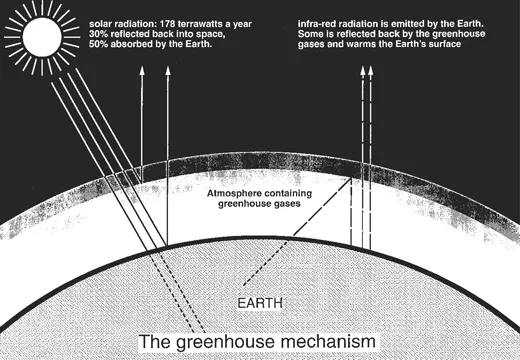
Figure 1.1
The greenhouse ‘blanket’
The greenhouse ‘blanket’
The main greenhouse gases are water vapour, carbon dioxide, methane, nitrous oxide and tropospheric ozone (the troposphere is the lowest 10–15 kilometres of the atmosphere).
The sun provides the energy which drives weather and climate. Of the solar radiation which reaches the Earth, one third is reflected back into space and the remainder is absorbed by the land, biota, oceans, ice caps and the atmosphere. Under natural conditions the solar energy absorbed by these features is balanced by outgoing radiation from the Earth and atmosphere. This terrestrial radiation in the form of long-wave, infra-red energy is determined by the temperature of the Earthatmosphere system. The balance between radiation and absorption can change due to natural causes such as the 11-year solar cycle. Without the greenhouse shield the Earth would be 33 C cooler, with obvious consequences for life on the planet.
Since the industrial revolution, the combustion of fossil fuels and deforestation has resulted in an increase of 26 per cent in carbon dioxide concentrations in the atmosphere. In addition, rising population in the less developed countries has led to a doubling of methane emissions from rice fields, cattle and the burning of biomass. Methane is a much more powerful greenhouse gas than carbon dioxide. Nitrous oxide emissions have increased by 8 per cent since pre-industrial times (IPCC 1992).
Climate Change – The Paleoclimate Record
In June 1990 scientists were brought up sharp by a graph which appeared in the journal Nature (Figure 1.2). It was evidence from ice core samples which showed a remarkably close correlation between temperature and concentrations of CO2 in the atmosphere from 160 000 years ago until 1989. It also revealed that present concentrations of CO2 are higher than at any time over that period. Since then the rate of increase has, at the very least, been maintained.
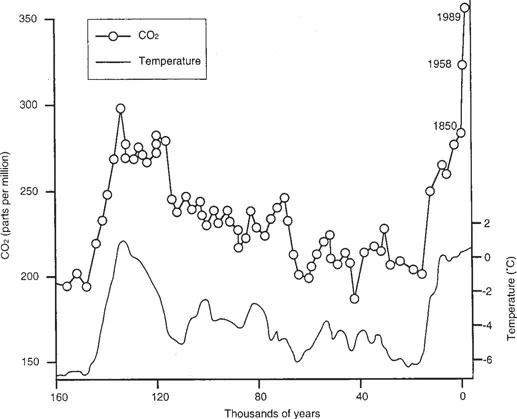
Figure 1.2
Correspondence between historic temperature and carbon dioxide
Correspondence between historic temperature and carbon dioxide
Ice core samples give information in four ways. First, their melt layers provide an indication of the time span covered by the core. Second, a measurement of the extent to which ice melted and refroze after a given summer gives a picture of the relative warmth of that summer. A third indicator is the heavy oxygen isotope 18O in air trapped in the ice. It is more abundant in warm years. Finally, the air trapped in the snow layers gives a measurement of the CO2 in the atmosphere in a given year. Other data from ice cores show that, at the peak of the last ice age 20 000 years ago, sea level was about 150 m lower than today.
Another source of what is called ‘proxy’ evidence comes from analysing tree rings. This can give a snapshot of climate going back 6000 years. Each tree ring records one year of growth and the size of each ring offers a reliable indication of that year’s climate. The thicker the ring, the more favourable the climate to growth. In northern latitudes warmth is the decisive factor. Some of the best data come from within the Arctic Circle where pine logs provide a 6000-year record.
The Climate Research Unit of the University of East Anglia has made a special study of the evidence for climate changes from different sources and has concluded that there is a close affinity between ice core evidence and that obtained from tree rings. Also instrumental records going back to the sixteenth century are consistent with the proxy evidence.
Causes of Climate Fluctuation
To be able to see the current changes in climate in context, it will be necessary to consider the causes of dramatic changes in the past.
A major cause of climate fluctuation has been the variation in the Earth’s axial tilt and the path of its orbit round the sun. The Earth is subject to the influence of neighbouring planets. Their orbits produce a fluctuating gravitational pull on the Earth, affecting the angle of its axis. As the Earth wobbles, vast ice sheets wax and wane over a cycle called a Milankovitch cycle. However, thanks to the stabilising pull of the moon, the variation in tilt is contained within limits which preserves the integrity of the seasons. Without the moon, the axis could move to 90 degrees from the vertical meaning that half the planet would have permanent summer and the other endless winter.
It has been calculated that the current orbital configuration is similar to that of the warm interglacial period 400 000 years ago. We may indeed be in the early stages of an interglacial episode and the accompanying natural warming which is being augmented by human induced warming. (For more information on climate fluctuations over the past million years see Houghton J. (2004) Global Warming, 3rd edn, Cambridge University Press.)
A second factor forcing climate change is the movement of tectonic plates and the resultant formation of volcanic mountains. In themselves mountains add to the stirring effect on the atmosphere in concert with the rotation of the Earth. They also generate fluctuations in atmospheric pressure, all of which affect climate.
But it is volcanic activity which can cause dramatic changes. The surface of the Earth is constantly shifting. The collision of plates accounts for the formation of mountains. A feature of plate tectonics is that, when plates collide, one plate slides under the other; this is called subduction. In the process rocks are heated and forced through the surface as volcanoes, releasing vast quantities of debris and CO2 in the process. In the short term this can lead to a cooling as the dust cuts out solar radiation. In the longer term, large injections of CO2 lead to warming, since CO2 has a relatively long life in the atmosphere.
A third factor may be a consequence of the second. Paleoclimate data show that there have been periodic surges of ice flows into the north Atlantic which, in turn, affect the deep ocean currents, notably the Gulf Stream. To understand why the ice flows affect the Gulf Stream we need to look at what drives this rather special current.
Particularly salty and warm surface water migrates from the tropics towards the north Atlantic. As it moves north it gradually becomes cold and dense, and, as a consequence, near Greenland it plunges to the ocean floor. This, in turn, draws warmer water from the tropics which is why it is also called the conveyor belt or deep ocean pump. It accounts for 25 per cent of the heat budget of northwest Europe. So, what is the relevance of the icebergs?
As these armadas of icebergs melted as they came south they produced huge amounts of fresh water which lowered the density of surface water undermining its ability to descend to the ocean floor. The effect was to shut down the conveyor belt. As a result northern Europe was periodically plunged into arctic conditions and scientists are concerned that there is now evidence that this process is beginning to happen due to melting ice in the southern tip of Greenland. After the melted iceberg water had dispersed, the conveyor started up again leading to rapid warming. This cycle occurred 20 times in 60 000 years, and the evidence indicates that cooling was relatively slow whilst warming was rapid – 10–12 C in a lifetime. For some reason these forays of icebergs stopped about 8000 years ago, creating relatively stable conditions which facilitated the development of agriculture and ultimately the emergence of urban civilisations.
A fourth factor may seem ironic, because ice ages can be triggered by warm spells leading to the rapid expansion of forests. This, in turn, leads to huge demands for CO2 which is drawn from the atmosphere.
The result of this stripping of atmospheric CO2 is a weakening of the greenhouse shield, resulting in sharply dropping temperatures.
Changes in energy levels emitted by the sun are also implicated in global fluctuations. In June 1999 the journal Nature (vol. 399, p. 437) published research evidence from the Rutherford Appleton Laboratory in Didcot, Oxfordshire which suggests that half the global warming over the last 160 years has been due to the increasing brightness of the sun. However, since 1970 the sun has become less responsible for the warming, yet the rate of warming has been increasing, indicating that increased greenhouse gases are the culprit. Some of the best evidence for the climatic effects of varying levels of radiative output from the sun comes from Africa. Sediment in Lake Naivasha in the Kenya Rift Valley reveals the levels of lake water over the past 1000 years. Periods of high water have higher concentrations of algae on the lake floor which translates to a higher carbon content in the annual layers of sediment. There were long periods of intense drought leading to famine and mass migrations, the worst being from 1000 to 1270 (Nature, vol. 403, p. 410).
Finally, we cannot ignore wider cosmic effects. The dinosaurs will testify to the effect on climate of meteor strikes creating perpetual night. New sites of catastrophic impacts are still being discovered on the Earth, but if we want a true picture of the historic record of meteor impact we can see it on Venus. The stability of that planet – no plate movement or vegetation to hide the evidence – ensures that we have a picture of meteor bombardment over hundreds of millennia. The Earth will have been no different.
There is strong historic evidence that life on Earth has a precarious foothold.
The palaeontological record shows that there have been five mass extinctions in the recorded history of the planet. The most widely known on the popular level is the final one which occurred at the end of the Cretacious period 65 million years ago. It is widely attributed to one or more massive meteorites that struck the Earth propelling huge quantities of debris into the atmosphere masking the sun probably for years. Photosynthesising plants were deprived of their energy source and food chains collapsed resulting in the extinction of 75–80 per cent of species, notably the dinosaurs.
However, of all the other mass extinctions, it is the third in the sequence that warrants most attention because it has contemporary relevance. At the end of the Permian period, 251 million years ago, a catastrophic chain of events caused the extinction of 95 per cent of all species on Earth. The prime cause was a massive and prolonged period of volcanic eruptions, not from mountains but from extensive fissures in the ground in the region which ultimately became Siberia. A chain of events caused massive expulsions of CO2 into the atmosphere which led to rapid warming and plant growth. This had the effect of stripping much of the oxygen from the atmosphere leading to a collapse of much of the biosphere. Plants and animals literally suffocated. For the next 5 million years the remaining 5 per cent of species clung to a precarious existence. It took 50 million years for the planet to return to anything like the previous rate of biodiversity (New Scientist, 26 April 2003, ‘Wipeout’).
The importance of this evidence lies in the fact that this mass extinction occurred because the planet warmed by a mere 6 C over a relatively short period in the paleoclimate timescale. Why this should concern us now is because the world’s top climate scientists on the United Nations Inter-Governmental Panel on Climate Change (IPCC 2002) estimated that the Earth could warm to around 6 C by the latter part of the century unless global CO2 emissions are reduced by 60 per cent by 2050 against the emissions of 1990.
It is the widescale evidence of anomalous climatic events coupled with the rate at which they are occurring that has persuaded the IPCC scientists that much of the blame lies with human activity.
The Evidence
- There has been a marked increase in the incidence and severity of storms over recent decades. Over the past 50 years high pressure systems have increased by an average of three millibars whilst low pressure troughs have deepened by the same amount, thereby intensifying the dynamics of weather systems. Greater extremes of the hydrological cycle are leading, on the one hand, to increased area of desert, and, on the other, greater intensity of rain storms which increase run-off and erosion of fertile land. In both cases there is a loss of carbon fixing greenery and food producing land.
- In the first months of 2000 Mozambique ...
Table of contents
- Cover
- Half Title
- Title Page
- Copyright
- Contents
- Foreword
- Acknowledgements
- Introduction
- 1. Climate change – nature or human nature?
- 2. Predictions
- 3. Renewable technologies – the marine environment
- 4. Renewable technologies – the wider spectrum
- 5. Low energy techniques for housing
- 6. Insulation
- 7. Domestic energy
- 8. Advanced and ultra-low energy houses
- 9. Harvesting wind and water
- 10. Existing housing: a challenge and opportunity
- 11. Low energy techniques for non-domestic buildings
- 12. Ventilation
- 13. Energy options
- 14. Lighting – designing for daylight
- 15. Lighting – and human failings
- 16. Cautionary notes
- 17. Life-cycle assessment and recycling
- 18. State of the art case studies
- 19. Integrated district environmental design
- 20. An American perspective
- 21. Emergent technologies and future prospects
- Appendix 1: Key indicators for sustainable design
- Appendix 2: An outline sustainability syllabus for designers
- Index
Frequently asked questions
Yes, you can cancel anytime from the Subscription tab in your account settings on the Perlego website. Your subscription will stay active until the end of your current billing period. Learn how to cancel your subscription
No, books cannot be downloaded as external files, such as PDFs, for use outside of Perlego. However, you can download books within the Perlego app for offline reading on mobile or tablet. Learn how to download books offline
Perlego offers two plans: Essential and Complete
- Essential is ideal for learners and professionals who enjoy exploring a wide range of subjects. Access the Essential Library with 800,000+ trusted titles and best-sellers across business, personal growth, and the humanities. Includes unlimited reading time and Standard Read Aloud voice.
- Complete: Perfect for advanced learners and researchers needing full, unrestricted access. Unlock 1.5M+ books across hundreds of subjects, including academic and specialized titles. The Complete Plan also includes advanced features like Premium Read Aloud and Research Assistant.
We are an online textbook subscription service, where you can get access to an entire online library for less than the price of a single book per month. With over 1.5 million books across 990+ topics, we’ve got you covered! Learn about our mission
Look out for the read-aloud symbol on your next book to see if you can listen to it. The read-aloud tool reads text aloud for you, highlighting the text as it is being read. You can pause it, speed it up and slow it down. Learn more about Read Aloud
Yes! You can use the Perlego app on both iOS and Android devices to read anytime, anywhere — even offline. Perfect for commutes or when you’re on the go.
Please note we cannot support devices running on iOS 13 and Android 7 or earlier. Learn more about using the app
Please note we cannot support devices running on iOS 13 and Android 7 or earlier. Learn more about using the app
Yes, you can access Architecture in a Climate of Change by Peter F Smith in PDF and/or ePUB format, as well as other popular books in Architecture & Architecture General. We have over 1.5 million books available in our catalogue for you to explore.