- 352 pages
- English
- ePUB (mobile friendly)
- Available on iOS & Android
eBook - ePub
Accounting and Finance for the International Hospitality Industry
About this book
Top experts specializing in hospitality management have contributed articles to this new collection which explains recent developments in accounting and finance. The material is drawn from a combination of fieldwork and practical experience.
The managerial emphasis means that the content is fully relevant internationally and not constrained by the legal framework of different countries. Accounting and Finance provides an overview of:
*analysis and evaluation of performance
*planning methods and techniques
*financial information and control
*financial management.
It also shows how operational analysis can be used as a management tool to improve performance. Techniques for predicting the financial success or failure of hotels are suggested. Research into hotel companies in the US and Europe demonstrates key performance indicators used by hotel managers and financial executives.
Other contributors explore the interface between accounting and marketing and human resource management and there is thorough coverage of financial strategy formulation. Readers will also find helpful the section on statistics in the analysis and prediction of cost behaviour in hotels.
Contributors: Raymond Schmidgall (Michigan State University, USA); Debra J. Adams (Bournemouth University, UK); Professor Elisa S. Moncarz (Florida International University, USA); Richard N. Kron (Kron Hospitality Consulting, USA); Angela Maher (Oxford Brookes University, UK); Peter J. Harris (Oxford Brookes University, UK); Geoff S. Parkinson (BDO Stoy Hayward Chartered Accountants, UK); Paul Fitz-John (Bournemouth University, UK); Paul Collier (University of Exeter, UK); Professor Alan Gregory (University of Glasgow, UK); Tracy A. Jones (Cheltenham and Gloucester College of Higher Education, UK); Jacqueline Brander Brown (The Manchester Metropolitan University, UK); Nina J. Downie (Oxford Brookes University, UK): Catherine L. Burgess (Oxford Brookes University, UK); Ian C. Graham (Holiday Inn Worldwide, Belgium); Howard M. Field (International Hotel and Leisure Associates, UK); Professor Paul Beals (Canisius College, USA); Frank J. Coston (Pannell Kerr Forster Associates, UK).
Trusted by 375,005 students
Access to over 1.5 million titles for a fair monthly price.
Study more efficiently using our study tools.
1 Performance Measures Used in Hotel Companies
Introduction
The overall objective of hotel companies is to provide satisfaction for their stakeholders. The stakeholders vary from guests, to employees (including management), to owners, to suppliers, to financial lenders, to the community where the hotel is located. Each stakeholder group seeks different ‘rewards’ from the hotel companies. First, the hotel guest often seeks quality services at a reasonable price. The services include but are not limited to food, beverages and lodging. The employees of the hotel companies seek monetary rewards including wages and fringe benefits, as well as non-financial rewards such as promotions and recognition. Management’s desires are similar to employees; however, they often include additional financial rewards such as capital in the employer’s company stock. Other stakeholders include the community in which the hotel is located and creditors including lenders of funds on both a long and short-term basis to the hotel. The community desires the hotel to be a credit to its environment and to ’serve’ the area. Suppliers desire to receive cash payments for their services on a timely basis while lenders seek the repayment of their funds, including interest. Finally, the owners who take the ultimate risk seek a fair return on their investment. This return takes two forms: first, dividends from the hotel to the owners are the return on their capital investment. The second reward is the increase in the value of the owners’ investment. This reward is easily measured by hotel companies whose capital stock is trade on stock exchanges such as the New York Stock Exchange, the London Stock Exchange or the Tokyo Stock Exchange.
In order for a hotel company to meet the desires of its stockholders (owners) the hotel must generate profits, that is revenue must exceed expenses. In essence this is the bottom line if the overall objective of a hotel company is to be satisfied. This chapter discusses performance measures used in hotel companies to determine and help ensure the achievement of the desired net income of a hotel company. First, the three major financial statements are presented and illustrated, followed by financial ratios used to reduce the statements to indicators of success.
Financial Statements
The three major financial statements include the balance sheet, the income statement, and the statement of cash flows. These statements are prepared at the end of the accounting period and are based on generally accepted accounting principles.1
The balance sheet, illustrated in Figure 1.1, reflects assets and claims to assets of the hypothetical Mayfair Hotel. Assets simply are items of value to the hotel company. The first claims to assets are by the creditors and these claims are referred to as liabilities. The claims which must be paid within a relatively short period of time are labelled as current liabilities while other obligations of the hotel company at the balance sheet date are long-term liabilities. The residual claims to assets are by the owners and are revealed in the owners’ equity section of the balance sheet. The claims to the assets equal the assets; thus this is the reason why this financial statement is called the balance sheet.
Figure 1.1 Balance sheets
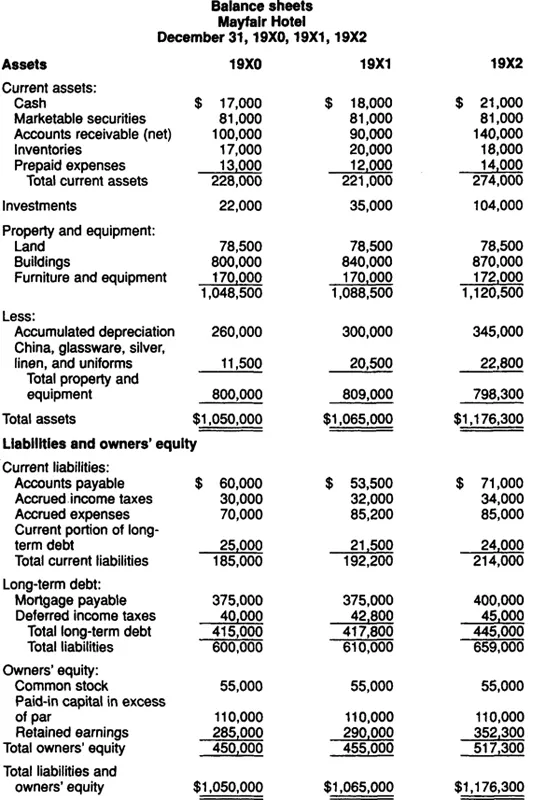
Assets are classified as current, investments, and property and equipment, as shown in Figure 1.1. The balance sheet is a static statement as it is prepared as of a given date, the last day of the accounting period. This statement reflects the accounting equation of assets equal liabilities plus owners’ equity. The balance sheet of the Mayfair Hotel reveals assets of $1,176,300 and liabilities and owners’ equity for the same amount on December 31,19X2.
The financial statement which reflects operations of the Mayfair Hotel is the income statement, as illustrated in Figure 1.2. The income statement includes both revenues (sales) and expenses. The income statement illustrated in this chapter contains considerable detail and reflects activity by areas of responsibility. The top section of the income statement contains the revenue, payroll and related costs, other direct expenses, and departmental income of the rooms department and indicates departmental income of $605,000 for 19X2. The second section reflects the operations of the food and beverage department. The top portion of the income statement down to ‘total operated departments income’ reflects activities of the profit centres, that is areas of activity that generate revenue and incur expenses resulting in profit (labelled as income in this illustration).
Figure 1.2 Income statements
Income statements Mayfair Hotel For the years ended December 31,19X1 and 19X2
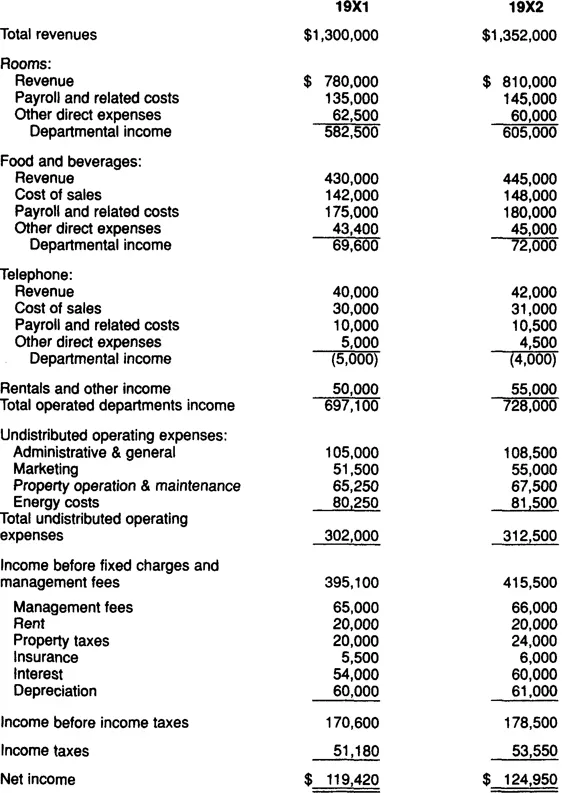
The next section of the income statement contains the operating overhead expenses and is labelled ‘undistributed operating expenses.’ This section is often divided into four lines including administrative and general, marketing, property operation and maintenance, and energy costs. Additional lines are provided for human resources, data processing, guest transportation, and entertainment for large hotels which have separate departments for these areas of responsibility. In general, these areas of responsibility are referred to as service centres since their objective is to provide services to other departments of the hotel. A detailed schedule is generally prepared for each profit and service centre and should contain sufficient detail to allow the department head to monitor expenses and revenues properly, if any, of their department.
The difference between income from the profit centres and the undistributed operating expenses is ‘income before fixed charges and management fees’ (sometimes referred to as gross operating profit – GOP). Expenses subtracted from this figure are based for the most part on decisions of the board of directors rather than management. The board decides whether to use a management company or hire managers as employees. The board determines the size of the hotel and its equipment which will be depreciated and how it is financed, which results in interest expense when funds are borrowed. Other fixed charges, such as fire insurance and property taxes, relate to the property and equipment. Thus, fixed charges are often referred to as capacity overhead. Income taxes based on income before taxes are subtracted to determine the hotel’s bottom line.
The income statement illustrated in this chapter is prepared for internal purposes, that is, to be used by the general manager and department heads.2 A much more abbreviated statement is prepared for outsiders such as creditors and even stockholders. The income statement is a dynamic statement as it covers a period of time. In relation to the balance sheet, the results of operations are recorded as a change in owners’ equity on the balance sheet at the end of the accounting period.
The third and final statement to be discussed is the statement of cash flows. This statement reflects the cash flows of the hotel company for a period of time. The three major sections of this statement reflect cash flows from operating, investing and financing activities. The statement of cash flows is illustrated in Figure 1.3, again using the hypothetical Mayfair Hotel. The operating activities show the reconciliation of net income for the accounting period to cash flows from operations. The first item shown in this section is net income followed by items to determine cash flow from operations such as depreciation and so on. The net cash flow from operating activities for 19X2 is $157,450.
Figure 1.3 Statement of Cash Flow
Statement of cash flow Mayfair Hotel December 31, 19X1 and 19X2
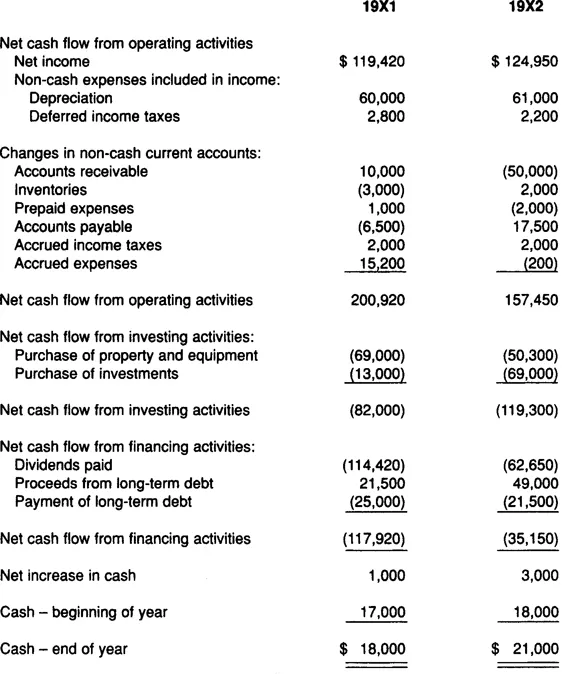
The investing activities of a hotel company generally include both the sale and purchase of investments and property and equipment. The Mayfair had limited investing activities during 19X1 and 19X2 as it did not sell any investments or property and equipment. It did make purchases in each year, including $119,300 during 19X2.
The financing activities section of this statement reflects receipt and disbursements of funds related to long-term debt and equity financing. The net cash outflow for the Mayfair was $35,150 for 19X2.
The change in cash for the period as shown on the statement of cash flows of $3,000 for 19X2 for the Mayfair Hotel is the difference between cash at the beginning of 19X2 ($18,000) and the end of 19X2 ($21,000), as reflected on the balance sheets of the Mayfair Hotel.
Analysis of Financial Statements
The financial statements contain considerable information. However, to reduce them to a few meaningful numbers, ratios are used. Ratios are simply a comparison of two numbers to yield a result. For example, the division of current assets by current liabilities results in a ratio called the current ratio.
Financial ratios are generally classified into five categories as follows:
- Liquidity.
- Solvency.
- Activity.
- Profitability.
- Operating.
Each class of ratios allows the analyst to determine the ’success’ in some way of the hotel. Liquidity ratios measure a hotel’s ability to pay its bills as they become due and the most commonly calculated liquidity ratio is the current ratio, mentioned above.
The solvency ratios measure the hotel’s ability to pay its bills in the long run. This class of ratios includes ratios based on balance sheet numbers, such as the debt-equity ratio and ratios based on the income statement such as the fixed-charge coverage ratio. These ratios will be explained later.
The activity ratios measure management’s use of the hotel’s assets. Two common activity ratios are the paid occupancy percentage and property and equipment turnover. Paid occupancy compares the number of rooms sold for the period to the number of rooms available. It is not a financial ratio; however, it is calculated on a daily basis by most hoteliers as an indicator of room sales success. The property and equipment turnover ratio compares revenue of the hotel from the income statement, to the property and equipment of the hotel as shown on the balance sheet.
The profitability ratios, most meaningful to owners, show the hotel company’s ability to generate profits. Since this is one of the major objectives of most hotels these ratios are generally the most frequently calculated for owners. Profitability ratios to be discussed in greater detail in this chapter include profit margin, earnings per share and return on owners’ equity.
The final class of ratios are the operating ratios, which reflect the results of operations. These measures of success are used most frequently by management and include the average daily rate (ADR), cost of labour percentage, cost of food percentage and operating efficiency ratio. A combination of the paid occupancy percentage and the ADR is revpar (see section on operating ratios, below). All these operating ratios will be discussed and their calculation illustrated in this chapter.
Perceptions of US lodging industry general managers and financial executives have been measured regarding the usefulness of financial ratios (Schmidgall, 1988, 1989). Members of each group through a mail survey were asked to reflect their perceptions of various users regarding the usefulness of ratios. The users included general managers, corporate (office) executives, owners and bankers. The overall results were as follows:
Both GMs and financial executives perceive the following:
- GMs find operating and activity ratios more useful than other user groups.
- Owners find profitability ratios more useful than other users.
- Corporate executives find liquidity ratios more useful than other user groups.
In regard to solvency ratios, the perceptions of GMs and financial executives differed. Financial executives believe bankers find this group of ratios most useful, while GMs perceive that owners find solvency ratios more useful than other groups.
Another way to view the results of this research is wh...
Table of contents
- Cover
- Dedication
- Half Title
- Title Page
- Copyright
- Contents
- Preface
- List of contributors
- Part I: Financial Analysis
- Part II: Financial Planning
- Part III: Financial Information and Control
- Part IV: Financial Management
- Index
Frequently asked questions
Yes, you can cancel anytime from the Subscription tab in your account settings on the Perlego website. Your subscription will stay active until the end of your current billing period. Learn how to cancel your subscription
No, books cannot be downloaded as external files, such as PDFs, for use outside of Perlego. However, you can download books within the Perlego app for offline reading on mobile or tablet. Learn how to download books offline
Perlego offers two plans: Essential and Complete
- Essential is ideal for learners and professionals who enjoy exploring a wide range of subjects. Access the Essential Library with 800,000+ trusted titles and best-sellers across business, personal growth, and the humanities. Includes unlimited reading time and Standard Read Aloud voice.
- Complete: Perfect for advanced learners and researchers needing full, unrestricted access. Unlock 1.5M+ books across hundreds of subjects, including academic and specialized titles. The Complete Plan also includes advanced features like Premium Read Aloud and Research Assistant.
We are an online textbook subscription service, where you can get access to an entire online library for less than the price of a single book per month. With over 1.5 million books across 990+ topics, we’ve got you covered! Learn about our mission
Look out for the read-aloud symbol on your next book to see if you can listen to it. The read-aloud tool reads text aloud for you, highlighting the text as it is being read. You can pause it, speed it up and slow it down. Learn more about Read Aloud
Yes! You can use the Perlego app on both iOS and Android devices to read anytime, anywhere — even offline. Perfect for commutes or when you’re on the go.
Please note we cannot support devices running on iOS 13 and Android 7 or earlier. Learn more about using the app
Please note we cannot support devices running on iOS 13 and Android 7 or earlier. Learn more about using the app
Yes, you can access Accounting and Finance for the International Hospitality Industry by Peter Harris in PDF and/or ePUB format, as well as other popular books in Business & Finance. We have over 1.5 million books available in our catalogue for you to explore.