Remote sensing is defined as a technique for identifying, classifying, and determining objects, as well as obtaining information on their physical properties through analysis of the data on the objects collected by remotely located sensors that do not contact physically with objects. Usually, the data analyzed are those on the electromagnetic waves emitted from or reflected by the objects. Remote sensing, in a narrow sense, is defined as a method for retrieving the physical properties of objects around the earth by remote sensors on platforms such as aircraft and satellites. Representative references on remote sensing are listed in reference books [1,2,3,4,5,6,7,8,9,10,11,12,13,14,15,16,17,18,19,20,21,22,23,24,25] and websites.
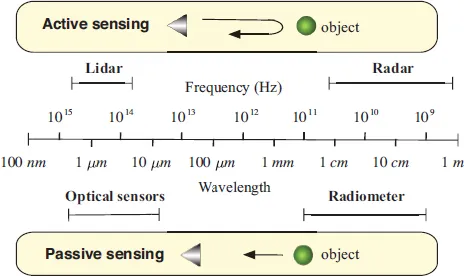
There are roughly two kinds of remote sensing methods as shown in Figure 1.1. The first one is passive remote sensing in which sensors receive the electromagnetic spectrum emitted from the object. Radiometer operative in the microwave frequency and optical sensors such as a spectrometer or hyper-spectral meter in the optical frequency are typical passive remote sensors. Passive sensors do not emit any signals toward objects just like a camera without flash light. The second one is active sensing in which sensors emit signals and receive the echo. Radio detection and ranging (radar), synthetic aperture radar (SAR), and light detection and ranging (lidar) are typical sensors. A camera with a flash light can be considered an active sensor. These categories together with the frequency range are shown in Figure 1.1 [16,23].
1.1.1 DIFFERENCE OF OPTICAL AND MICROWAVE SENSORS
Optical remote sensing has a longer history than microwave sensing. Images obtained by optical sensors, such as photographs, is rather familiar to our eyes and feelings. We can interpret optical images based on our visual perception. In addition to visible light bands, there are many spectral bands in the optical region, which have specific responses to physical quantity, such as infrared to thermal temperature and certain bands to chlorophyll. On the other hand, microwave images generated by SAR are not so familiar to everybody. Since we cannot see microwaves at all, the images generated by microwaves are out of our perception range. For example, if we see a forest image by a P-band microwave radar, the image looks completely different from that of an optical sensor. P-band frequencies can partially penetrate forests. The reflection image from a forest area shows tree echoes and underlying ground information. In an optical image, we always see the top canopies of the forest. This makes the two images totally different. This difference comes from the propagation and scattering properties inherent to the frequency, and hence the information obtained by optical and microwave regions becomes totally different.
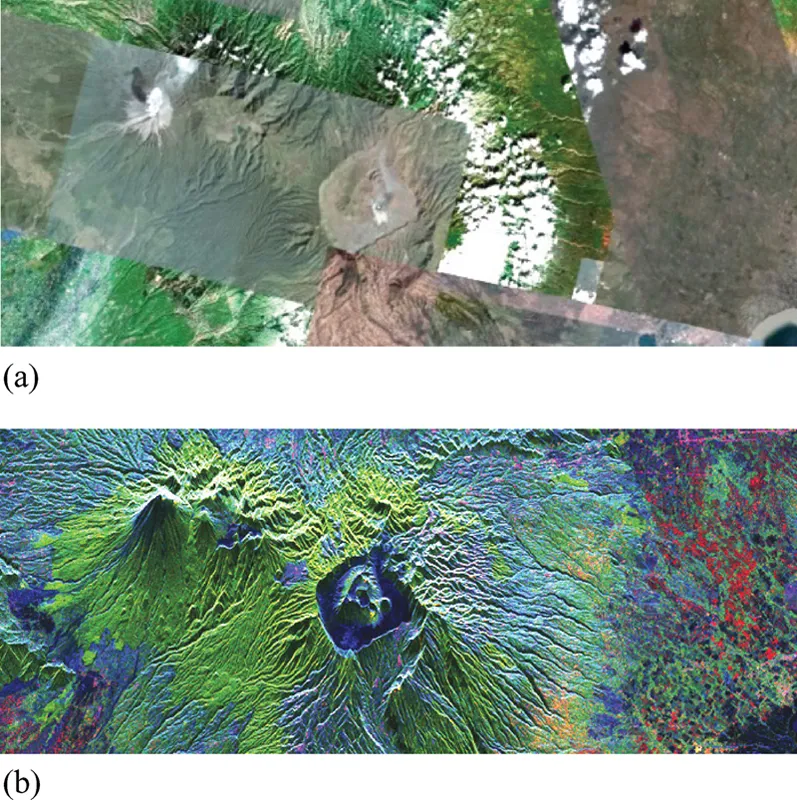
One example is shown in Figure 1.2 where Mt. Bromo, Indonesia, is imaged by an optical sensor and microwave radar (Polarimetric SAR, ALOS-PALSAR). In the optical image, we see a white cloud covering the mountain slope and smoke erupting from a volcano summit. It is impossible to see beneath the cloud of smoke because optical waves cannot penetrate. Since this image size is approximately 40 × 70 km, several optical subimages (taken at different times and conditions) are combined to make the whole image. On the other hand, it is possible to see all information on the ground objects by radar. There is no effect of clouds in the SAR image due to the penetration capability of microwaves. In addition, the information in the image looks different because color coding as well as scattering mechanisms are different. Polarimetric information is used to create the full-color image based on the scattering mechanisms.
In rainforest areas near the equatorial region, the land is covered by clouds almost 90% of the time. The penetration of clouds is one of the most important issues for remote sensing from the sky. The penetration capability depends on the attenuation characteristics of electromagnetic waves in the atmosphere. The attenuation constant (dB/km) shows how the wave is attenuated in 1000 m propagation. The value is less than 0.01 dB for 1 GHz and increases with frequency up to 4–5 dB for 10 GHz in heavy rain conditions [26]. For the optical region, the attenuation is more than 100 dB, which means the optical wave is not available for sensing. Water vapor or aerosol in the atmosphere causes the attenuation in the optical wave.
1.1.2 RADAR REMOTE SENSING
In this book, we deal with microwave SAR. In the microwave frequency region, frequencies are further divided into some bands as shown in Table 1.1. Each band has special frequency characteristics for targets with respect to target size and material constants having electrical properties. It is known the C-band, which is suited for crop monitoring, and the L-band is suitable for forest, land cover, disaster monitoring, etc. The lower frequency can propagate with low attenuation and penetrate the medium deeper inside. The P-band wave can penetrate not only forests but also dry ground, snow, ice, and the soil surface at several centimeters. The higher frequency above the X-band scatters at the surface of objects and does not penetrate objects. The scattering nature at higher frequency becomes close to those of optical waves. Therefore, these bands are suited for high-resolution imaging of terrain.
In addition to penetration (reflection, attenuation) characteristics, there is another physical effect, that is, resonance by the wavelength. Since the wavelength of microwave frequency ranges approximately from 1 to 100 cm, many object sizes can be in the same order of the wavelength or multiple of half wavelength. Resonance or Bragg scattering can occur when the phase condition matches. Sometimes we see strong Bragg scattering in crop fie...