
eBook - ePub
Japanese Phoenix: The Long Road to Economic Revival
The Long Road to Economic Revival
- 320 pages
- English
- ePUB (mobile friendly)
- Available on iOS & Android
eBook - ePub
About this book
Japan will recover and its economic achievements will once again earn the world's admiration, with sustained annual growth of three percent, perhaps more, well within reach. This is the confident forecast that begins Japanese Phoenix: The Long Road to Economic Revival by the author of Japan: The System That Soured, which several years ago accurately predicted Japan's current travails at a time when others were prematurely pronouncing full recovery. Katz warns however that there is bad news to go with the good. So deep-seated are Japan's dysfunctions that, even if it did everything right today, it would take at least five years for truly vibrant growth to take hold. But Japan will not do everything right. Opposition to reform is deep-seated and a myriad of vested interests and millions of jobs are at stake. Still he notes, there is little doubt that reform will succeed. Japanese Phoenix tells the story of the struggle between the forces of reform and the forces of resistance. It dissects Prime Minister Koizumi's role in the process, and explains why Japan is in so much trouble and what needs to be done. It explore the debates among economists and gives a careful progress report on all the moves made so far in the name of reform - from greater direct foreign investment, to the financial "Big Bang", to ending one-party rule by the Liberal Democratic Party. Katz concludes that this is just the second round of a 15-round fight. Japan is a great nation currently trapped in obsolete institutions. As it has before, Japan will find a way to surmount its problems and regain its forward progress.
Trusted by 375,005 students
Access to over 1.5 million titles for a fair monthly price.
Study more efficiently using our study tools.
Information
Subtopic
Business GeneralIndex
EconomicsPart One
A Tale of Two Problems: Supply and Demand
2
The Incredible Shrinking Japan
So accustomed are we to Japan’s malaise that we forget how stunning and recent is its descent. In looking over my 1998 book Japan: The System That Soured to prepare for this one, I was struck by how much time the book spent just trying to demonstrate that Japan was in serious trouble, let alone explain why. A full chapter had to be devoted to debunking the so-called revisionists, some of whom claimed Japan’s travails were a hoax. As recently as 1995, journals such as Foreign Affairs and Business Week lionized a book whose subtitle was Why Japan Is Still on Track to Overtake the U.S. by the Year 2000.1
In March 1997, when many economists were trumpeting Japan’s alleged comeback, this author wrote, “Unless the country undertakes a sweeping reform of institutions and policies, it will be lucky to get back to 2 percent annual growth over the next five years.”2 At the time this seemed unduly pessimistic. In retrospect it turned out to be wildly overoptimistic. If current estimates prove correct, Japan will have suffered virtually zero growth during the five years from 1998 to 2002 (Figure 2.1a).
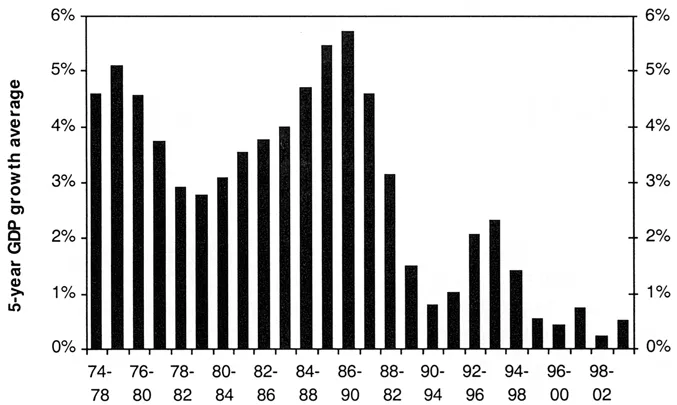
Figure 2.1a Five-Year GDP Growth Moving Toward Zero
Source: Cabinet Office for 1974-2001, consensus forecast for 2002 and 2003.
Note: Each column gives the average real GDP growth for the five-year period named, e.g., 0.3 percent for 1998-2002.
Back in the mid-1990s, 2 percent growth was the level that reformers warned that the country might descend to. How things had changed by 2000, when the prime minister, Keizo Obuchi, held up 2 percent growth as the goal to strive for, and by 2002, when Koizumi held up 1.5 percent growth as the measure of victory.3 What was once considered the worst that might happen is now, we are told, the most that Japan can achieve.
Japan’s performance over the past decade has been worse than almost any other rich country in the postwar era. The nation once forecast to own the twenty-first century has seen its economic ranking fall drastically. In a number of key indicators, from share of rich-country GDP to share of world exports, Japan hit its peak in the late 1980s and has since fallen substantially. Given current trajectories, its weight in the world economy will continue to plummet.
A few other industrialized countries have suffered similar problems. But almost no other has suffered so severely for so long, because the other nations solved their problems. So can Japan.
During the past five decades only three other industrialized countries have averaged zero or negative growth over a five-year period: Sweden, Finland, and Switzerland, all in the early 1990s (Switzerland also suffered a five-year slump after the 1973 oil shock). Like Japan, all three countries suffered banking crises in the early 1990s, as did the United States. None grew until it solved its crisis. Almost all grew again once they solved it, Finland at rates around 5 percent. The important exception was Switzerland, which, like Japan, had deeper problems. A banking crisis alone would not have sent Japan into such intractable malaise.
Taking the longer view, Japan’s average GDP growth per capita during the dozen years from 1992 to 2003 is on track to descend to a dismal 0.7 percent. Among rich countries, only Switzerland did worse. In most cases, the worst period spanned the oil shocks of 1973 and 1980 (Figure 2.1b).
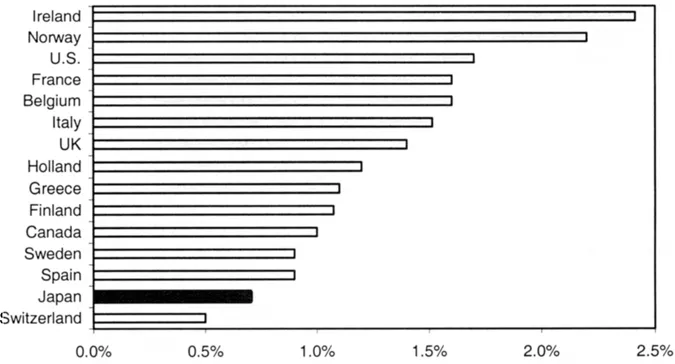
Figure 2.1b Japan’s Worst Dozen Years Is Worse Than Others’
Source: World Bank for 1960-2001, consensus GDP forecast for Japan of –0.8 percent for 2002 and 0.8 percent for 2003.
Note: Each bar shows the average annual per capita GDP growth during each nation’s worst12-year period since 1960, e.g., the United States grew 1.7 percent per capita during 1971-82.
The comparison with Switzerland is telling, since it was afflicted by the same witch’s brew that laid low Japan: a worsening dual economy of efficient sectors and inefficient sheltered sectors, leading to steady deceleration in productivity growth and eventual banking crisis, all made worse by counterproductive fiscal policies. The encouraging news is that, after Switzerland tackled its banking crisis and began other structural reforms, its growth improved to 2 percent during the period 1997-2000.
Japan’s Shrinking Weight in the World
A century from now, economic historians may well look back at 1985-91 as Japan’s high-water mark in the world economy—the reversal of more than a century of history. After rising from the 1870s onward, Japan’s share of world GDP peaked in 1991 at 9 percent. Even with an optimistic forecast of 2 percent growth, by 2010 Japan’s share of world GDP will drop back to only 6 percent.
This alone is not necessarily a sign of weakness. As countries mature, they grow more slowly than emerging countries such as China or South Korea. More remarkable is that Japan’s growth is lagging behind its fellow rich countries. Even with 2 percent growth in Japan, Japan’s share of rich-country GDP will fall from 15.6 percent in 2000 to 12 percent by 2010 (Figure 2.2). More likely its share will fall even faster.
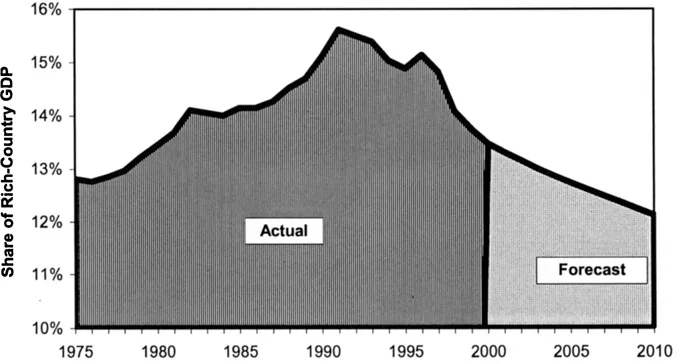
Figure 2.2 Japan’s Share of Rich-Nation GDP Plunging
Source: World Bank 2000 for 1975-98, IMF 2000a for 1999-2010.
Note: For 1975-99, GDP is measured on the purchasing power parity (PPP) basis that is usually used for international comparisons. For 2000-10, the projection relies on IMF forecasts that advanced countries will grow 3 percent and Japan will grow at about 2 percent a year.
A shrinking share of the world output is, by itself, no disaster. Many fairly small countries live quite prosperously and happily. However, to the extent that political leverage stems from economic prowess, Japan’s shrinkage has important geopolitical ramifications. Integrating a rising China into the world community of nations would be a lot easier with a vibrant Japan.
Not only is Japan’s weight in the world dropping, but so is its relative living standard. After more than a century of struggle, Japan’s real per capita GDP had reached almost 90 percent of U.S. levels by 1991. A decade later Japan had retreated to 76 percent of U.S. levels. In 1991 Japan’s per capita GDP was 5 percent higher than the average among fifteen high-income countries. By 2000 it was 6 percent lower. A decade hence, it will be lower still.4
Contrary to popular impression, Japan has also fared poorly on the export front. From 1960 to 1986 Japan’s vaunted export machine tripled its share of world goods and services exports from 3 percent to nearly 9 percent. Now it’s down to 6.7 percent and, given current trajectories, will fall to 5.4 percent by decade’s end (Figure 2.3).
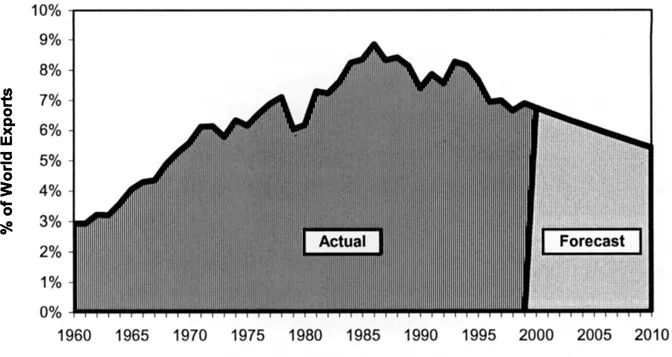
Figure 2.3 Japan’s Share of World Exports Drops After 1986
Source: World Bank 2000 for 1960-98, IMF 2000a for 1999-2010.
Note: Goods and services exports in current dollars. The projection for 1999-2010 assumes that global exports will continue to expand at the same 6.7 percent rate that the IMF forecasts through 2005. It also assumes that Japanese exports continue at the same rate as in the IMF estimate for 1992-2001, which was 4.4 percent.
What Went Wrong? Structural Versus Macroeconomic Schools
Prescribing the right medicine requires that we first make the right diagnosis. Unfortunately, economists disagree.
Some analysts, including myself, stress structural (i.e., institutional) factors that afflict both productivity growth and aggregate demand. In this view, Japan will never enjoy sustained revival without thorough overhaul.
“Nonsense,” say many academic macroeconomists, who claim that easily correctable policy mistakes are the real problem. In this view, Japan followed the same path as other countries where financial bubbles popped. However, Japan’s fiscal and monetary policies were too tight. If Tokyo simply applied enough stimulus, along with a cleanup of the nonperforming loan crisis, Japan would do quite nicely.
Stimulus is certainly necessary. But it is not sufficient. The macroeconomic explanation cannot be the whole story because insufficient demand is only one-quarter of Japan’s problem. No matter how much demand stimulus is applied, it cannot help the supply-side factors, which make up three-quarters of the problem (Figure 2.4).
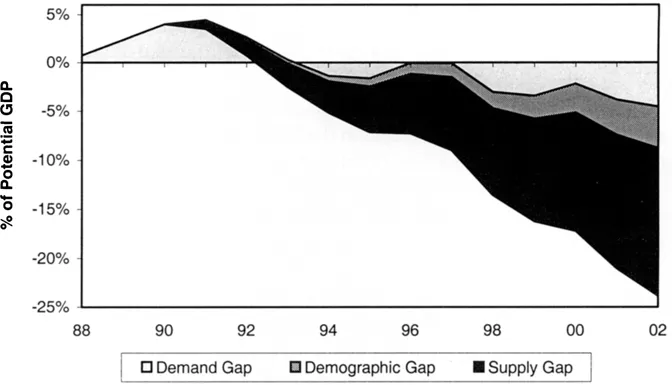
Figure 2.4 Lost GDP: Supply Factors Overwhelm Demand Factors
Source: Calculations by author using data from Bayoumi 2000a, p. 104 and Cabinet Office 2002a.
Note: The 0 percent axis measures Japan’s potential GDP had it sustained the 3.74 percent growth rate in potential GDP that it enjoyed in 1987-90. The gray area, the demand gap, shows how far above or below potential GDP is actual GDP. At the end of the bubble, Japan was operating 4 percent above capacity; in 2002, a projected 6 percent below capacity. In 1996-97, despite the years of stagnat...
Table of contents
- Cover
- Half Title
- Title Page
- Copyright Page
- Dedication
- Table of Contents
- List of Tables and Figures
- Technical Notes
- Acknowledgments
- Introduction
- Part One A Tale of Two Problems: Supply and Demand
- Part Two Macroeconomic Policy Debates
- Part Three Globalization: A Progress Report
- Part Four Structural Reform: A Progress Report
- Part Five U.S.-Japan Relations in This Crisis
- Epilogue
- Notes
- Bibliography
- Index
- Appendices and Updates
Frequently asked questions
Yes, you can cancel anytime from the Subscription tab in your account settings on the Perlego website. Your subscription will stay active until the end of your current billing period. Learn how to cancel your subscription
No, books cannot be downloaded as external files, such as PDFs, for use outside of Perlego. However, you can download books within the Perlego app for offline reading on mobile or tablet. Learn how to download books offline
Perlego offers two plans: Essential and Complete
- Essential is ideal for learners and professionals who enjoy exploring a wide range of subjects. Access the Essential Library with 800,000+ trusted titles and best-sellers across business, personal growth, and the humanities. Includes unlimited reading time and Standard Read Aloud voice.
- Complete: Perfect for advanced learners and researchers needing full, unrestricted access. Unlock 1.5M+ books across hundreds of subjects, including academic and specialized titles. The Complete Plan also includes advanced features like Premium Read Aloud and Research Assistant.
We are an online textbook subscription service, where you can get access to an entire online library for less than the price of a single book per month. With over 1.5 million books across 990+ topics, we’ve got you covered! Learn about our mission
Look out for the read-aloud symbol on your next book to see if you can listen to it. The read-aloud tool reads text aloud for you, highlighting the text as it is being read. You can pause it, speed it up and slow it down. Learn more about Read Aloud
Yes! You can use the Perlego app on both iOS and Android devices to read anytime, anywhere — even offline. Perfect for commutes or when you’re on the go.
Please note we cannot support devices running on iOS 13 and Android 7 or earlier. Learn more about using the app
Please note we cannot support devices running on iOS 13 and Android 7 or earlier. Learn more about using the app
Yes, you can access Japanese Phoenix: The Long Road to Economic Revival by Richard Katz in PDF and/or ePUB format, as well as other popular books in Economics & Business General. We have over 1.5 million books available in our catalogue for you to explore.