eBook - ePub
How Cities Will Save the World
Urban Innovation in the Face of Population Flows, Climate Change and Economic Inequality
- 282 pages
- English
- ePUB (mobile friendly)
- Available on iOS & Android
eBook - ePub
How Cities Will Save the World
Urban Innovation in the Face of Population Flows, Climate Change and Economic Inequality
About this book
Cities are frequently viewed as passive participants to state and national efforts to solve the toughest urban problems. But the evidence suggests otherwise. Cities are actively devising innovative policy solutions and they have the potential to do even more. In this volume, the authors examine current threats to communities across the U.S. and the globe. They draw on first-hand experience with, and accounts of, the crises already precipitated by climate change, population shifts, and economic inequality. This volume is distinguished, however, by its central objective of traveling beyond a description of problems and a discussion of their serious implications. Each of the thirteen chapters frame specific recommendations and guidance on the range of core capacities and interventions that 21st Century cities would be prudent to consider in mapping their immediate and future responses to these critical problems. How Cities Will Save the World brings together authors with frontline experience in the fields of city redevelopment, urban infrastructure, healthcare, planning, immigration, historic preservation, and local government administration. They not only offer their ground level view of threats caused by climate change, population shifts, and economic inequality, but they provide solution-driven narratives identifying promising innovations to help cities tackle this century's greatest adversities.
Trusted by 375,005 students
Access to over 1.5 million titles for a fair monthly price.
Study more efficiently using our study tools.
Information
Chapter 1
Cities and the Financial Crisis
Ray Brescia
The Financial Crisis of 2008, and the foreclosure crisis that both preceded and followed it, resulted in financial hardship for many. Large financial houses closed or were absorbed into other financial institutions. Homeowners in the United States lost trillions of dollars in the collective value of their homes. Countless businesses shut their doors forever. Families were foreclosed upon and evicted. Many are still unemployed or have simply stopped looking.
Cities have borne the brunt of much of these aftereffects of the Financial Crisis. Indeed, it is in cities where the Financial Crisis's toll is, perhaps, the greatest. Cities often must deal with foreclosed and abandoned properties that scar the landscape and become magnets for crimes like arson, prostitution, and drug dealing. Shuttered businesses mean empty storefronts and reduced sales revenue. The precipitous drop in home values in many communities has meant a concomitant reduction in tax revenue for many cities. Couple that with the fact that abandoned properties rarely produce local tax revenues and one sees many cities hovering near the brink of bankruptcy, if they have not already hurtled into that financial abyss.
While much of the oversight of financial institutions in the United States occurs at the national level, and, to a lesser extent, in the states, cities are not powerless to combat the effects of the Financial Crisis on their bottom lines or community well-being. Some cities are fighting back, and many have the tools at their disposal to protect their citizens, strengthen their sources of revenue, and combat predatory behavior from financial institutions. This chapter will review both the causes of the Financial Crisis of 2008 as well as its consequences on US cities, with a particular focus on the connection between these causes and consequences and economic and racial inequality. It will then describe an array of tactics that cities are deploying to respond to the lasting effects of the Crisis. Specifically, this chapter will describe a range of these tools, namely: litigation to combat discriminatory predatory lending, responsible banking ordinances, so-called "Community Impact Report Cards" for financial institutions, and the use of eminent domain to address underwater mortgages.
These local regulators tools offer cities and other local governments the chance to have a say in the way that financial institutions function and operate within their borders. They give these local governments a role in addressing some of the fallout from the Financial Crisis of 2008, and can help shape financial institution behavior moving forward. As this chapter explains, some of the harshest effects of financial crises can occur at the local level, where foreclosures—just one common by-product of the last such crisis—wreak havoc on local government functions and finances. Because of that, local governments need tools to address the fallout from such crises and the ability to try to prevent the next one. If the Financial Crisis of 2008 was the result of legal and regulatory failures at the national level, and this chapter will explore that question, cities, which are affected most dramatically by financial crises, should ensure they are doing all that they can to help shape financial institution behavior.
The Impact of the Financial Crisis on Cities
The main impact on US cities of the Financial Crisis of 2008 is the loss of property tax revenue. This loss of revenue comes about for three main reasons. First, foreclosures drive down property values in neighboring properties, as described below. This reduction in property values often results in a downward revaluation of properties for tax purposes with a corresponding reduction in the amount of taxes paid by homeowners. When a property is foreclosed upon, it is often sold at auction at a bargain basement price. In addition, in a so-called "short sale," a pre-foreclosure sale, a property is also sold at a reduced rate. Appraisers then use the ultimate sale price of these properties as "comparable'' property values when appraising neighboring properties. These lower appraisals then can factor into the taxes homeowners pay their local governments. Second, when a property is abandoned, the owner of that property rarely pays taxes on it. Finally, when a community is particularly hard hit by abandonment, this drives down investment in the community and results in residential flight, further reducing the tax base. But not only does a municipality lose tax revenue, it also must often expend resources to maintain and police abandoned properties.
A number of studies over the last 15 years have attempted to assess the impact of foreclosures on the value of neighboring properties, and the picture that emerges is a bleak one. In the late 1990s, a group of researchers looked at the impact of foreclosures in the Chicago area and found that the value of each single-family home within one-eighth of a mile of a foreclosed property dropped by between 0.9 percent and 1.136 percent for each foreclosure (Immergluck and Smith 9). Each foreclosed property reduced the value of neighboring properties in the aggregate by as much as $371,000 (Ibid., 11). A recent study by the Federal Reserve Bank of Atlanta found that property values in the late 2000s, on average, were reduced by nearly one percent due to nearby foreclosures. The researchers attributed at least some of that reduction to disinvestment in properties in foreclosure and delays in the foreclosure process (Gerardi Kristopher, et al. 13-14, 33). While early studies of the current foreclosure crisis predicted a modest reduction in home values as a result of this crisis of between $356 billion to $1.2 trillion in home values (Pew Charitable Trusts 10; Global Insight 2), one current analysis is far more dramatic, as the US Government Accountability Office assesses the loss of homeowner equity as a result of the Financial Crisis at over $9 trillion (2013).
Foreclosures and short sales are not the only ways that neighboring homeowners lose value in their homes. And they are not the only ways that municipalities suffer when properties are foreclosed upon and/or are abandoned. When a property is neglected by the homeowner, or post-foreclosure, by the foreclosing entity that takes title to it, it can create an eyesore in the neighborhood or worse as those parties fail to maintain the lawns, facades, and other cosmetic elements of the property, or fail to ensure necessary repairs are made in a timely fashion. Once a property falls into disrepair, the cost of repairs can increase exponentially. A simple water leak or defective heater, if neglected, can lead to extensive and Structural damage. Clearly, abandoned properties become a magnet for crime.
All of these forces align to not just lower property values, which has a ripple effect on city coffers, but also to force local governments to spend resources on property maintenance, emergency response to fires and injuries occurring on site, and policing these properties (Apgar, Duda and Nawrocki Gorey, 10-11). When homeowners in arrears on their mortgages also neglect to pay their property taxes, cities can choose not to expend resources to foreclose on their tax liens, instead choosing to sell such liens for a fraction of their face value (Ibid., 7). One study of the impact of the recent foreclosure crisis on states estimated that taxing entities in just 10 states stood to lose a total of $6.6 billion in tax revenue in 2008 alone (Global Insight, 5). Cities lose even when they decide simply to demolish abandoned properties rather than allow them to stand, thereby eliminating their attractiveness to criminals and vandals. The cost to municipalities to address vacant homes, whether through policing, response to a fire, or other interventions, can cost a local government as much as $34,000 per property (Apgar, et al., 23).
While many of these forces have aligned to diminish the tax base of municipalities hard hit by foreclosures, what they, together with other economic forces unleashed by the Financial Crisis of 2008, are also doing is threatening the population base of many cities, particularly those in the Northeastern United States. Of course, this threat is part of a trend that has taken place over the last 50 years, as many of the so-called "Rust Belt" cities have seen reductions in population of over 50 percent in the last 50 years, including Buffalo, NY; Cleveland, OH; Detroit, MI; St. Louis, MO; and Youngstown, OH.
It is evident from this review that US cities are bearing much of the financial brunt of the lasting effects of the Financial Crisis. But what were some of the causes of the crisis, and what are some potential strategies cities can deploy to remedy its effects? This next section explores the forces that coalesced to create the impacts cities continue to face as a result of the Financial Crisis of 2008. Subsequent sections will explore potential responses cities can undertake to address such impacts and prevent future crises.
The Forces at the Heart of the Financial Crisis
While it is said that success has many parents while failure is an orphan, the causes of the Financial Crisis can be traced back many decades. This brief overview highlights some of the causes of the Financial Crisis and then attempts to tie them back to the impacts of the Crisis on municipalities.
Deregulation of the US financial industry in the 1980s and 1990s cleared a path for the creation of the subprime mortgage products at the center of the Crisis (Mansfield, 493). At the same time, mortgage lenders began to automate the mortgage underwriting process. This allowed them to write more mortgages (Financial Crisis Inquiry Commission. 72). They also developed new mortgage products that became increasingly exotic, with new features that created new markets for borrowers previously excluded from home finance because they could not satisfy lenders' underwriting criteria (Moran, 21-22). While this criteria may have traditionally kept certain communities from gaining access to credit regardless of their members' creditworthiness, the new criteria often allowed those who could not repay a mortgage access to mortgage finance (Engel and McCoy, 33). Another development, namely, the ability to securitize mortgages, when coupled with new mortgage products and new markets, allowed financial institutions to increase the number of mortgages they could write. This new financial vehicle—the securitized mortgage—permitted mortgage lenders to convert what were historically the future income streams from mortgagor payments into liquid assets; these liquid assets could then fuel more mortgage lending (Ibid., 17-26). What is more, new compensation schemes rewarded mortgage brokers who would increase loan volume regardless of borrower creditworthiness. Similarly, mortgage lenders would receive fees from investment banks for packaging loans for securitization. This came to be known as an "originate-to-securitize" approach, where the goal of mortgage origination was simply to gather more loans for securitization and sale on the secondary mortgage market where investors were hungry for such products (Financial Crisis Inquiry Commission, 8).
Credit rating agencies also received fees for their work, blessing these mortgage-backed financial products with little regard for their future financial viability or the strength of the underlying mortgages (Financial Crisis Inquiry Commission, 43-44).
In the background of all of this financial engineering was a time of relaxed monetary policy that encouraged bank lending because those banks' costs to borrow were incredibly low (Bar-Gill and Warren, 3-5). Low relative returns on Treasury bills encouraged investors to seek the higher returns typically promised through investments in mortgage-backed securities (Financial Crisis Inquiry Commission, 85). These expected returns from mortgage-backed securities whet the appetite of investors to invest in them at precisely the time when mortgage lenders increased their home mortgage lending as described above, through new mortgage originations and mortgage refinancing. Outsized profits in the mortgage-backed securities market spurred investment banks to encourage mortgage lenders to generate more mortgages (Moran, 24-25). Once mortgage lenders had saturated the market through loans to all of those traditional or "prime" borrowers they could find, they used new products to reach less creditworthy borrowers with subprime loans (Engel and McCoy, 35-36).
This combination of forces—new sources of capital, new mortgage products, and lowered underwriting criteria—meant an influx of fluids in the home mortgage market. This influx helped to create an asset bubble. Once that asset bubble popped, it generated a dramatic drop in home values. For borrowers in adjustable rate mortgages, reduced home values meant they could no longer refinance their mortgages to avoid the rising interest rates as mortgage lenders were no longer refinancing mortgages where the value of the home was less than the outstanding principal on the mortgage the borrower was trying to refinance (Ibid., 22-26). As borrowers lost the ability to refinance, they began to default on their loans, tipping the financial dominos that ultimately took down the economy.
Looking Deeper: Economic and Racial Inequality at the Heart of the Financial Crisis
This review of some of the forces behind the Financial Crisis of 2008 and its aftermath overlooks yet another potential cause of the Crisis, one that exists, not at the level of laws, regulations, and policies, but in the market, where bankers, brokers, and borrowers engaged in millions of transactions across the US. These transactions reveal perhaps another cause of the Crisis: social distance. Social distance is a term used to describe the differences we perceive between ourselves and others, between ingroup members and outgroup members, and status differences (Liberman, Trope, and Stephan, 357). A review of the lending practices that led up to the Financial Crisis and the subsequent path of the foreclosure crisis that followed reveals that social distance in two particular manifestations—economic inequality and racial differences—may have lurked beneath many of these transactions, resulting in trillions of dollars in home equity losses, foreclosures and evictions.
The height of the foreclosure crisis likely occurred in 2010, a time when income inequality had followed a decades-long stretch in which it increased considerably in the United States. One common measure of the economic inequality that exists in a society is the Gini coefficient or Gini index. As the US government's Census Bureau describes it, the Gini Index "varies from 0 to 1, with a 0 indicating perfect equality, where there is a proportional distribution of income. A 1 indicates perfect inequality, where one household has all the income and all others have no income." (Noss, 1.) Over the years, the Gini Index for the United States as a whole has fluctuated, but it has increased over the last few decades. When compared to other nations, the US Gini Index ranks the US among countries that are not typically associated with the US in terms of economic fairness, like Uruguay, Georgia, and El Salvador (World Bank, 2015).
An assessment of mortgage delinquency rates by states in 2010 reveals that states with higher levels of income inequality, as measured by the Gini Index, had, on average, higher delinquency rates. I use mortgage delinquency rates here as a proxy for predatory conduct because loans issued during the mortgage frenzy of the last decade that had predatory features were much more likely to enter into delinquency and default than loans without such features (Ding, et al., 2010). The figure below, which reveals this connections, plots delinquency rates by states in relation to each state's Gini coefficient. The higher the Gini score, on average, the greater the delinquency rate.
Racial distinctions can also create social distance. And if social distance based on race was one of the drivers of predatory mortgage lending, we would likely see the extension of credit on less-than-favorable terms along racial lines, which is precisely what happened in the middle part of the last decade. Research conducted by staff at the US Federal Reserve analyzed data available as a result of the requirements of the Home Mortgage Disclosure Act, through which financial institutions report their lending practices. This research reveals that, in 2006, nearly 54 percent of home mortgages extended to African-American borrowers had sub-prime features, while just 18 percent of loans to Whites had similar features, a nearly three-to-one ratio. Even controlling for a range of differences between Whites, African-Americans and Latinos, including income, these researchers found that over 30 percent of African-American borrowers, 24 percent of Latino borrowers, and just 18 percent of White borrowers received loans with predatory features. This research thus reveals that—even controlling for differences in income—African-American borrowers and Latino borrowers were 75 and 36 percent more likely, respectively, than White borrowers to enter into loans with subprime features (Avery, et al.).
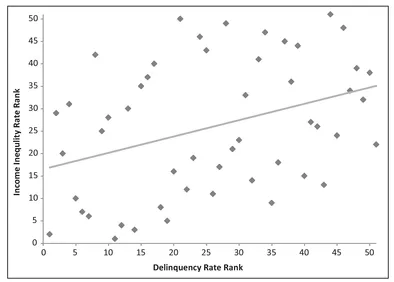
Figure 1.1 Delinquency Rates/Gini Index by State (Brescia, 2011)
The New York Times analyzed lending data in the New York City metropolitan region during the height of the subprime lending frenzy of the last decade and found similar patterns, particularly as such lending impacted the African-American middle class. This analysis yielded the following conclusion: " [T]he hardest blows rain down on the backbone of minority neighborhoods: the black middle class. In New York City, for example, black households making more than $68,000 a year are almost five times as likely to hold high-interest subprime mortgages as are whites of similar—or even lower—incomes." (Powell and Roberts, 2009).
But risky lending did not just impact borrowers adversely, as evidenced by mortgage delinquencies and foreclosures. Indeed, well over 100 mortgage lenders shuttered their businesses in the wake of the mortgage frenzy, and analysis of their lending patterns reveals that they, too, tended to lend disproportionately to borrowers of color, extending loans to them on unfair terms. Analysis of 2006 HMDA data from 167 financial institutions that closed their doors in 2007 shows that a disproportionate share of their subprime lending involved borrowers of color compared to industry averages. Seventy-four percent of the loans made to African-Americans by these failed lenders were subprime loans, and 63 percent of the loans made to Latinos had such features, compared to the industry average of 54 and 47 percent, respectively, as indicated in Figure 1.2.
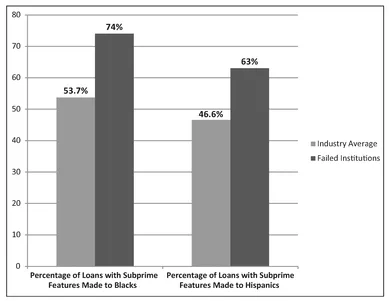
Figure 1.2 Data on 2007 Failed Institutions (Avery, et al...
Table of contents
- Cover
- Half Title
- Title
- Copyright
- Contents
- List of Figures
- List of Abbreviations
- Contributors
- Foreword
- Preface
- Acknowledgments
- Introduction
- 1 Cities and the Financial Crisis
- 2 Assessing Metropolitan Resiliency: Laying the Foundation for Urban Sustainability
- 3 Avoiding Atlantis: Protecting Urban Cultural Heritage from Disaster
- 4 Moving to Safety? Opportunities to Reduce Vulnerability through Relocation and Resettlement Policy
- 5 Developing the Sustainable City: Curitiba, Brazil, as a Case Study
- 6 Exploring Options for Urban Sustainability in an Era of Scarce Water Resources: A Possible Ban on Lawns
- 7 Think Global, Pay Local
- 8 Cities and Immigration Reform: National Policy from the Bottom Up
- 9 Can Charter Schools Save Cities? Social Capital and Urban Public Education
- 10 Cities Seeking Justice: Local Government Litigation in the Public Interest
- 11 Strategic Code Compliance Enforcement: A Prescription for Resilient Communities
- 12 Renegotiating the Constituent's Role in Urban Governance: Participatory Budgeting in New York City
- 13 Financing Urban Transportation Infrastructure: Old and New Approaches for Funding Urban Regeneration and Resiliency: The Atlanta Example
- Index
Frequently asked questions
Yes, you can cancel anytime from the Subscription tab in your account settings on the Perlego website. Your subscription will stay active until the end of your current billing period. Learn how to cancel your subscription
No, books cannot be downloaded as external files, such as PDFs, for use outside of Perlego. However, you can download books within the Perlego app for offline reading on mobile or tablet. Learn how to download books offline
Perlego offers two plans: Essential and Complete
- Essential is ideal for learners and professionals who enjoy exploring a wide range of subjects. Access the Essential Library with 800,000+ trusted titles and best-sellers across business, personal growth, and the humanities. Includes unlimited reading time and Standard Read Aloud voice.
- Complete: Perfect for advanced learners and researchers needing full, unrestricted access. Unlock 1.5M+ books across hundreds of subjects, including academic and specialized titles. The Complete Plan also includes advanced features like Premium Read Aloud and Research Assistant.
We are an online textbook subscription service, where you can get access to an entire online library for less than the price of a single book per month. With over 1.5 million books across 990+ topics, we’ve got you covered! Learn about our mission
Look out for the read-aloud symbol on your next book to see if you can listen to it. The read-aloud tool reads text aloud for you, highlighting the text as it is being read. You can pause it, speed it up and slow it down. Learn more about Read Aloud
Yes! You can use the Perlego app on both iOS and Android devices to read anytime, anywhere — even offline. Perfect for commutes or when you’re on the go.
Please note we cannot support devices running on iOS 13 and Android 7 or earlier. Learn more about using the app
Please note we cannot support devices running on iOS 13 and Android 7 or earlier. Learn more about using the app
Yes, you can access How Cities Will Save the World by Ray Brescia,John Travis Marshall in PDF and/or ePUB format, as well as other popular books in Politics & International Relations & Urban Planning & Landscaping. We have over 1.5 million books available in our catalogue for you to explore.