Quality Sampling and Reliability
eBook - ePub

Quality Sampling and Reliability

New Uses for the Poisson Distribution

  1. 176 pages
  2. English
  3. ePUB (mobile friendly)
  4. Available on iOS & Android
eBook - ePub

Quality Sampling and Reliability

New Uses for the Poisson Distribution

About this book

As a mathematical model for determining the probable number of outcomes, the new Poisson Distribution tables have long been an easier tool to use for reliability analyses. Longtime quality professional, inventor, and consultant John J. Heldt now makes the Poisson Table even more useful-creating two new tables (available only in this book) with the Poisson terms rearranged for further ease of estimation.

Quality Sampling and Reliability: New Uses for the Poisson Distribution simplifies the steps involved with reliability testing; Mean Time Between Failure (MTBF) assessment; advantages and risks involved in reliability life testing; and an example of methodology for tracking the MTBF for products in the field.

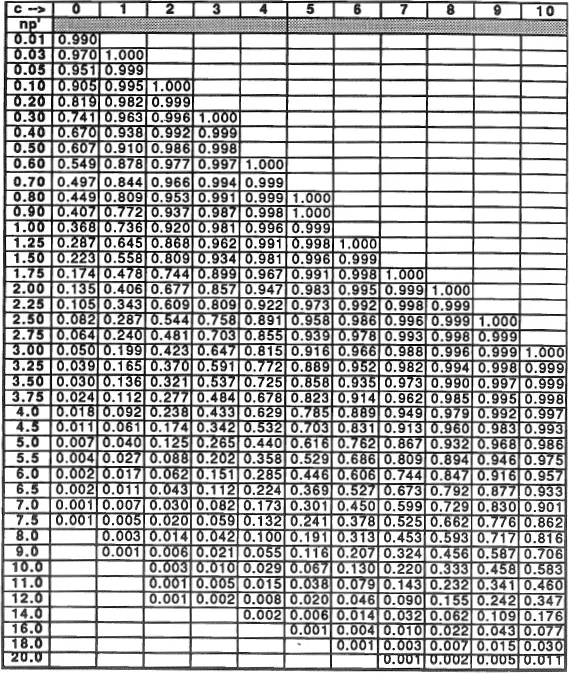
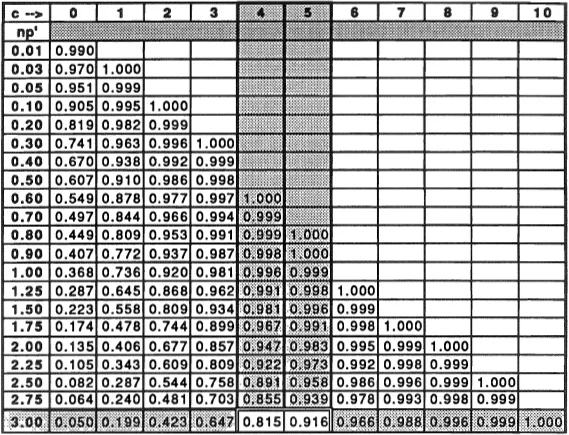
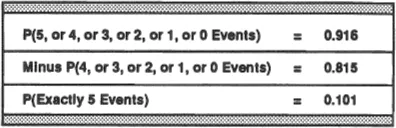
In addition to the tried-and-true Standard Poisson table, used to review conventional Poisson uses, Heldt's two variations yield these results:

  • Estimations of product Mean Time Between Failures (MTBFs), based on life tests-including the 90%, 80% or 60% envelop for any MTBFs that have been derived
  • Development of the Operating Characteristic Curves for Life testing-showing the risks and advantages of any test used to assure the product MTBF is not varying in a detrimental manner

    Written for easy comprehension, with numerous illustrations, Quality Sampling and Reliability: New Uses for the Poisson Distribution will help quality professionals, engineers, instructors and students alike in their reliability testing tasks.
  • Trusted by 375,005 students

    Access to over 1 million titles for a fair monthly price.

    Study more efficiently using our study tools.

    Information

    Publisher
    CRC Press
    Year
    2020
    Print ISBN
    9781574442410
    eBook ISBN
    9781000162226

    1

    APPLICATIONS USING THE CONVENTIONAL POISSON TABLE

    1.1 THE CUMULATIVE POISSON DISTRIBUTION TABLE4

    Before we can develop applications using the Poisson table, we need to show what PT-1 (see Appendix 1) can do. Those already familiar with the use of this table can skip through this section.
    The first page of the cumulative Poisson distribution is shown in Figure 1. The numbers across the top of the table designate the number of events, identified as c numbers. For sample plan purposes, these c numbers can be considered the number of failures.
    The expected values5 (np are in the column at the left edge of the chart. The n part of this np represents the “sample size.” The p represents the inherent fraction defective in the lot under test.
    Probabilities that c or fewer events will occur are shown in the body of this table. For sample plans, these probabilities are the probability of acceptance (Pa).
    images
    Figure 1 Cumulative Poisson Distribution (the probability of c or fewer occurrence of an event that has an expected value equal to np).

    1.2 HOW TO FIND INDIVIDUAL POISSON PROBABILITIES FROM THE CUMULATIVE POISSON TABLE

    Figure 2A shows how individual probabilities can be found, using this Poisson table. In this example, the fraction (0.916) is found where the “c = 5” column6 intersects the “np = 3.00” line.6 in other words,
    images
    Figure 2A Cumulative Poisson Distribution (the probability of c or fewer occurrence of an event that has an expected value equal to np).
    0.916=P(5)+P(4)+P(3)+P(2)+P(1)+P(0)
    It also means that 0.916 is the probability of finding 5 or fewer bad parts (failures) in an n = 100 sample, when the true fraction (p)7 of defectives in the lot is 0.03 (i.e., np = 100 × 0.03 = 3.0).
    This example shows the meaning of cumulative in the name of this table. Cumulative means that all of the Pa values listed in the column under the c = 5 column head are the addition of all of the probabilities up to and including the probability of finding 5 failures. Thus, each Pa shown in the c = 0 column is the probability of finding exactly 0 failures, since there are no previous probabilities to add. All of the Pa values in the c = 1 column are the probabilities of finding 1 or 0 failures. All Pa values in the c = 2 column are the probabilities of finding 2, or 1, or 0 failures in the sample, and so on.
    images
    Figure 2B How to find the probability of exactly five events when the expected value (np) equals 3.00.
    Figure 2B shows how subtraction is used to find the Pa for an exact number of failures from this table. To illustrate, the Pa fraction (0.815) found where the c = 4 column intersects the np = 3.00 line is the probability of finding 4 or 3, or 2, or 1, or 0 failures when the sample size (n) multiplied by the true fraction of defects (p) in the lot (np) is equal to 3.00. To find the probability of finding exactly 5 failures, we subtract P(4 or less) from P(...

    Table of contents

    1. Cover
    2. Half Title
    3. Title Page
    4. Copyright Page
    5. Table of Contents
    6. Preface
    7. The Author
    8. 1 Applications Using the Conventional Poisson Table
    9. 2 Applications Using the Probability of Acceptance Poisson Table
    10. 3 Quick and Easy Poisson Applications
    11. 4 Double Sampling Using Poisson Applications
    12. 5 Applications Using the Poisson Confidence Level Table
    13. 6 Applications Using the Poisson Probability of Acceptance Table
    14. 7 MTBF Tracking Program Based on Field Data Using the Poisson Confidence Level Table
    15. Appendix 1: Cumulative Poisson Distribution: Poisson PT-1
    16. Appendix 2: Probability of Acceptance: Poisson PT-2
    17. Appendix 3: Confidence Level: Poisson PT-3
    18. Index

    Frequently asked questions

    Yes, you can cancel anytime from the Subscription tab in your account settings on the Perlego website. Your subscription will stay active until the end of your current billing period. Learn how to cancel your subscription
    No, books cannot be downloaded as external files, such as PDFs, for use outside of Perlego. However, you can download books within the Perlego app for offline reading on mobile or tablet. Learn how to download books offline
    Perlego offers two plans: Essential and Complete
    • Essential is ideal for learners and professionals who enjoy exploring a wide range of subjects. Access the Essential Library with 800,000+ trusted titles and best-sellers across business, personal growth, and the humanities. Includes unlimited reading time and Standard Read Aloud voice.
    • Complete: Perfect for advanced learners and researchers needing full, unrestricted access. Unlock 1.4M+ books across hundreds of subjects, including academic and specialized titles. The Complete Plan also includes advanced features like Premium Read Aloud and Research Assistant.
    Both plans are available with monthly, semester, or annual billing cycles.
    We are an online textbook subscription service, where you can get access to an entire online library for less than the price of a single book per month. With over 1 million books across 990+ topics, we’ve got you covered! Learn about our mission
    Look out for the read-aloud symbol on your next book to see if you can listen to it. The read-aloud tool reads text aloud for you, highlighting the text as it is being read. You can pause it, speed it up and slow it down. Learn more about Read Aloud
    Yes! You can use the Perlego app on both iOS and Android devices to read anytime, anywhere — even offline. Perfect for commutes or when you’re on the go.
    Please note we cannot support devices running on iOS 13 and Android 7 or earlier. Learn more about using the app
    Yes, you can access Quality Sampling and Reliability by John J Heldt in PDF and/or ePUB format, as well as other popular books in Business & Business General. We have over one million books available in our catalogue for you to explore.