![]()
Section 1
Ethnic diversity and identity
![]()
TWO
How has ethnic diversity grown?
Stephen Jivraj and Ludi Simpson
Key findings
- In 2011, one in five people in England and Wales (20 per cent) described their ethnic group as other than White British compared with 13 per cent in 2001.
- The population other than White British, White Irish and Other White has doubled in size since 1991, from 3 to 7 million, while remaining a small minority of the total population in 2011 (14 per cent).
- The Black African ethnic group has grown faster than any other minority group in the last two decades, doubling in 1991-2001 and 2001-11 to reach 990,000 in 2011.
- Ethnic diversity is increasing in all parts of England and Wales, and at a faster rate in those places where minority ethnic groups were fewest in 2001.
- Minority ethnic groups remained clustered in certain diverse urban areas, most notably London.
- There has been continued ethnic group mixing within families. The number of people identifying with a ‘Mixed’ ethnic category increased by 82 per cent between 2001 and 2011 to more than a million.
- The proportion of mixed households has grown in 346 out of 348 local authority districts in England and Wales. Excluding one-person households, one in eight households now have more than one ethnic group.
- New measures in the census show that the majority of people from minority ethnic groups describe themselves as British, do not have a minority religion, and speak English as their main language.
Context
British society is becoming increasingly ethnically diverse. This is a pattern that has been documented throughout the post-war period and more widely since the inclusion of an ethnic group question in the 1991 Census (Rees and Butt, 2004). Prior to the 1950s, the minority ethnic population was small and largely confined to a small number of dockland areas (Peach, 1996). The post-war immigration to Britain was initially dominated by people arriving from the Caribbean who quickly became outnumbered by those from South Asia, whose immigration was tied to events in the New Commonwealth countries (Coleman and Salt, 1996). By 1991, a youthful age structure meant many groups were growing rapidly through an excess of births over deaths.
This chapter and the next describe the growth of ethnic diversity between 1991 and 2011 in England and Wales. This chapter shows how it is occurring in all parts of the country, and not just in those places where minority groups are most clustered. It goes on to profile the Mixed ethnic group and multiple ethnic groups households. The chapter ends with a comparison of alternative indicators of minority identity that were included in the census for the first time in either 2001 or 2011. These show that the majority of people from minority ethnic groups see themselves as British, report no religion or being Christian, and speak English as their main language. Chapter Three then describes how minority ethnic groups have grown since 1991, and estimates the contribution of international migration, births and deaths.
Growth of ethnic diversity
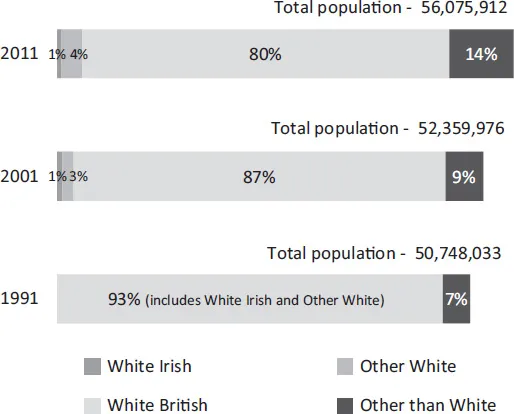
In 2011, the White British ethnic group, including English, Welsh, Scottish and Northern Irish denominations, accounted for 80 per cent of the 56 million people living in England and Wales. Figure 2.1 shows that the group’s population remained fairly stable in size during the 2000s, decreasing by only 1 per cent. The other 20 per cent of the population contained a diverse mix of minority ethnic groups that grew during the same decade by 4.2 million, a 64 per cent increase.
The largest minority group in 2011 was Other White, which describes the ethnicity of almost 2.5 million people. The Other White group grew by more than 80 per cent (or 1.1 million people) between 2001 and 2011, driven by immigration from Eastern Europe following European Union (EU) enlargement in 2004. The only minority ethnic group to decrease in size during the 2000s was White Irish, by almost 18 per cent. The source of these changes is described further in Chapter Three.
The White Irish and Other White groups were not separated from the White British group in 1991 when only a White group was measured. The White population, in total, remained relatively stable between 1991 and 2011, growing by only 2 per cent. The population other than White more than doubled in size during the same period, from 3.3 million (or 7 per cent of the population) to 7.9 million (or 14 per cent of the population).
Figure 2.1: Minority ethnic population in England and Wales, 1991-2001-2011
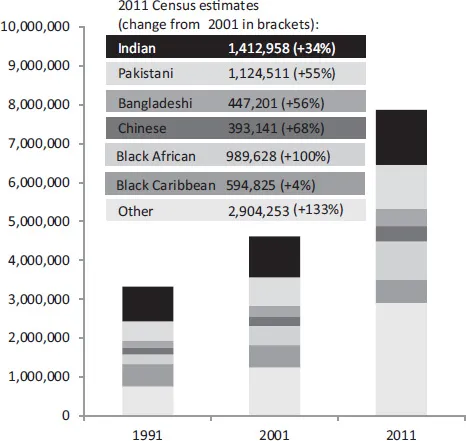
Figure 2.2: Ethnic groups other than White in England and Wales, 1991-2001-2011
Note: the ‘Other’ groups are Mixed (see later) – 1,224,400 (+82%); Other Asian – 835,720 (+238%); Other Black – 280,437 (+186%); Arab – 230,600 (not measured before 2011); Other – 333,096 (+46%).
There has been growing diversity in the ethnic groups that make up the other than White population throughout the period 1991 to 2011 (see Figure 2.2). The faster rate of growth in some of the smaller ethnic groups meant that by 2011 the ethnic mix of the population was more varied than in 1991 or 2001. The ethnic group that has experienced the greatest increase in population between 1991 and 2011 is Black African, which grew almost three-fold to almost a million people by 2011. The Bangladeshi, Pakistani and Chinese groups doubled in size, and the Indian group grew by a little more than half. The Black Caribbean group grew by only 4 per cent between 1991 and 2001.
The Other category grew by 284 per cent between 1991 and 2011. This provides an indication of the increased diversity of the population in England and Wales. The Other group, however, should not be compared over time because it is not made up of the same ethnic groups between censuses (for example, Mixed), and because the stability of responses to the category by the same individuals was low between censuses (for example, Other Asian and Other Black). Chapter Six explores the high instability in the ‘Other’ ethnic group categories. The change in the Mixed ethnic groups between 2001 and 2011 is described later in this chapter.
Geographical spreading of ethnic diversity
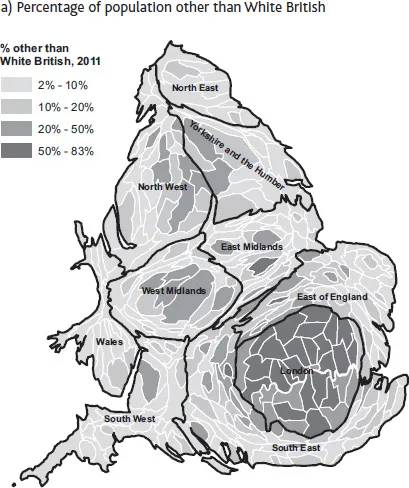
The geographical distribution of minority ethnic groups continues to reflect the historic settlement patterns of immigrant groups in England and Wales. London remains the place of initial settlement of most new immigrants, and the location where minority ethnic groups remain most clustered. In 2011, people from minority ethnic groups accounted for more than half the population in the London region as a whole, and within 23 of the 33 local authority districts that make up the region (see Figure 2.3a). London includes the most ethnically diverse districts in the country, including Newham and Brent. Slough, Luton and Leicester became the first districts outside of London where no one ethnic group was in the majority in 2011. Chapter Four further discusses these ‘plural’ local authority districts.
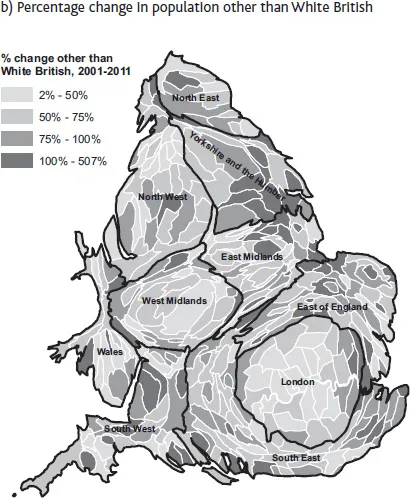
Although the minority ethnic population remains clustered in and around selected towns and cities where they or their ancestors initially settled, clear indications of residential mixing between 2001 and 2011 are evident. Figure 2.3b shows the percentage change in the population other than White British between 2001 and 2011 in every district in England and Wales. The districts that have experienced the greatest percentage growth in the minority ethnic population are those places where they were fewest in 2001. This reflects dispersal of minority ethnic groups towards districts adjacent to immigrant settlement areas (for example, Bexley in London) as well as new immigration to parts of the country with very small minority ethnic populations (for example, Boston in the East Midlands).
Figure 2.3: Ethnic diversity and change in ethnic diversity, by local authority district in England and Wales, 2001-11
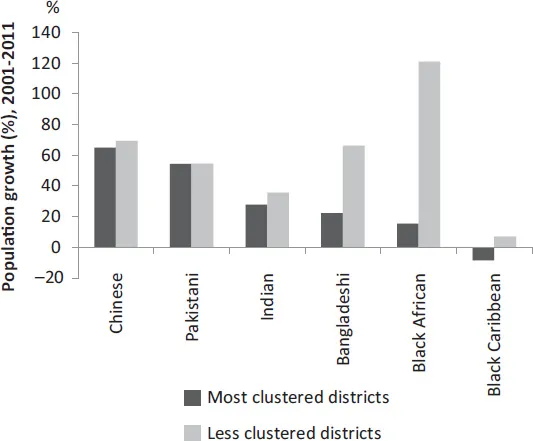
Figure 2.4: Growth in population by ethnic group in the districts where each group was most clustered, and everywhere else in England and Wales, 2001-11
Figure 2.4 shows this pattern of residential spreading between 2001 and 2011 for selected ethnic groups. It shows the proportionate change in the population in districts where a group is most clustered (those containing a fifth of the population of each ethnic group in 2001), and the proportionate change of each ethnic group in all other districts. The pattern across each ethnic group is greater growth in those districts where they were less clustered compared with a smaller or negative change in the most clustered districts, except for the Pakistani group, where the difference is very small.
Ethnic mixing
Mixed ethnic groups
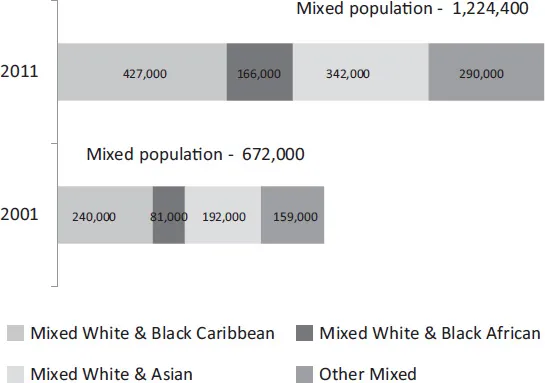
The Mixed ethnic group population, only measured in the 2001 and 2011 Censuses, almost doubled in size during the decade by adding more than half a million people to its population (see Figure 2.5). In 2011, more than 1.2 million people (2 per cent of the total population) described their ethnicity as Mixed. The largest Mixed ethnic group is the White & Black Caribbean (427,000), followed by Mixed White & Asian (341,000), Other Mixed (290,000) and Mixed White & Black African (166,000). All four groups grew by more than three-quarters between 2001 and 2011, with the smallest group, Mixed White & Black African, increasing at the fastest rate (106 per cent). This also signals the increased ethnic diversity in the England and Wales population.
Figure 2.5: Growth of Mixed ethnic groups in England and Wales, 2001-11
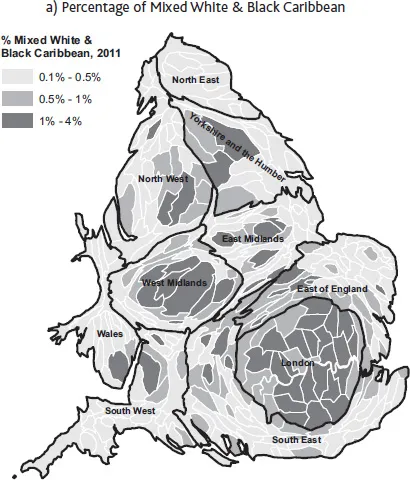
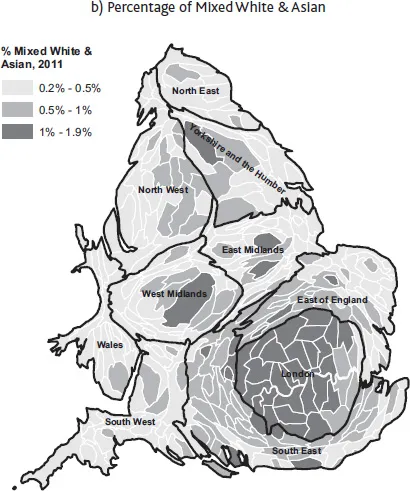
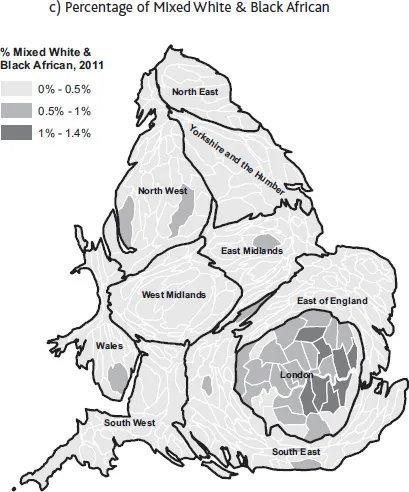
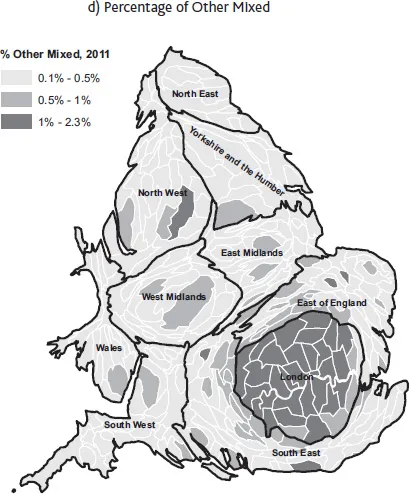
Figure 2.6a-d shows a commonality in the geographies of Mixed ethnic groups, with the greatest clusters of each Mixed group in London. The geographies of Mixed groups, however, are not as clustered in London as minority ethnic groups as a whole. For example, a lower proportion of those in the Mixed White & Black Caribbean and Mixed White & Asian groups live in London, especially inner London, compared with all minority ethnic groups. There are no districts where any Mixed group accounted for more than 4 per cent of the population.
The Mixed White & Black Caribbean group, which accounts for 0.8 per cent of the population nationally, is most clustered in Nottingham (East Midlands), Wolverhampton (West Midlands) and Lewisham (London), where at least 3 per cent of the population are in this group (Figure 2.6a). More than 2 per cent of the population in Lambeth, Croydon, Islington and Hackney in London, and Birmingham and Sandwell in the West Midlands, describe themselves as Mixed White & Black Caribbean.
Less than 2 per cent of the population describe themselves as Mixed White & Asian in any districts in England and Wales, and account for 0.6 per cent of the population nationally. The greatest clusters of the Mixed White & Asian group are in North and West London, including the districts of Kensington and Chelsea, Camden, Barnet, Westminster, Kingston upon Thames, Richmond upon Thames, and the City of London (Figure 2.6b).
Figure 2.6: Geography of Mixed ethnic groups in England and Wales, 2011
There were only eight districts, all in London, where the Mixed White & Black African group accounted for more than 1 per cent of the population. The group accounts for 0.3 per cent of the population in England and Wales as a whole. The greatest clusters of Mixed White & Black African group are in South London, including Lambeth, Lewisham and Southwark (Figure 2.6c). The extremely diverse Other Mixed group accounted for more than 2 per cent of the population in Lambeth, Haringey, Islington and Hackney, and 0.5 per cent of the population nationally (Figure 2.6d). The only district outside London where more than 1 per cent of the population describe themselves as Other Mixed is Manchester (North West).
Households with more than one ethnic group
Multiple ethnic groups within a household became relatively common in 2011 -one in every eight households is formed of people from different ethnic groups living together. We count here only households of two or more people that can have multiple ethnic groups. In 2011, the number of households with multiple ethnic groups was 2 million, or 12 per cent. This figure has increased by half from 1.4 million in 2001.
Half of multiple ethnicity households have couples of different ethnic groups. About a quarter have different ethnicity only between generations, such as a White Irish parent with White British children. The rest, about a fifth, are different combina...