![]()
THREE
Researching agri-environmental problems with others
Sue Oreszczyn, Les Levidow and Dave Wield
Editors’ introduction
Working towards sustainable agriculture often involves working on contested or controversial issues with others. They involve a complex mix of people, all with their own opinions and ways of seeing the world, such as civil society organisations, policymakers and companies. All the agri-environmental projects (those concerned with the environment but carried out in agricultural contexts) discussed in this chapter involve controversial issues, such as the introduction and development of GM crops, the potential power of large biotechnology companies, the increased use of biofuels, water and intensification of agriculture. As with the next chapter (Chapter Four), this chapter discusses the use and value of mapping techniques in these highly contested environmental research contexts. However, unlike Chapter Four the projects drawn on here were all large scale, multi-partner, European projects. The processes and mapping techniques were chosen for specific purposes, according to the needs of the different projects, the context and type of participants involved and their strategic aims. They also represent the development of the authors’ approaches to engaging with people and demonstrate the way that the approach has changed over time as they have sought ways to enable participants to engage in the research process more fully. Thus while the final project discussed in this chapter is less about mapping, it is included because its unusual funding arrangements enabled a different mode of research participation that provided useful insights for the more action-oriented research we advocate in this book.
Introduction
Several of the mapping techniques presented in this book have evolved from their use in business and organisational knowledge management (for example, Eden, 1988; Huff, 1990), as have the theories from which they draw, such as communities of practice (Lave and Wenger, 1991), networks of practice (Brown and Duguid, 2001) and tacit versus explicit knowledge (Collins, 2010; Polyani, 2015 [1958]), discussed in more detail in Chapters Four and Seven. These techniques and theories are concerned with how informal or tacit knowledge is generated and managed in organisations and have been used by consultants and practitioners as well as academics to link theory and practice (see for example, Huff and Jenkins, 2002). The mapping techniques used by the projects in this chapter were, likewise, originally devised by people who were paid to help companies clarify their strategic options. As you will see, the research projects adapted these techniques and used them for analysing different people’s, groups’ or organisations’ perspectives on environmental issues. Importantly, they also used them to help establish very different relationships with their stakeholders.
The projects in this chapter particularly address the way that social science has been challenged to provide a more solid and less disparate evidence base for making policy decisions (Lyall et al, 2004; Oakley, 2001, Nutley, 2003; Solesbury, 2001). The first two project examples, Policy Influences in Technology for Agriculture (PITA) and Precautionary Expertise for GM Crops (PEG), were conducted at a time when, despite efforts by researchers to give more attention to dissemination and end-user needs, few research projects actually attempted to directly involve policymakers within the research process itself. They represented a step forward in thinking about how participants, in this case companies and senior policymakers, may be more involved. The third, more recent, project discussed – Cooperative Research on Environmental Problems in Europe (CREPE) – goes one step further, not only more actively involving participants, but also attempting to work with them as equal partners.
Mapping with companies
In this first example on policy influences in technology on agriculture (PITA), project participants were treated more as informants than partners in the project: partly as a result of the thinking in methodological approaches at the time and partly as a necessary way of working with major multinational companies with little time for researchers. Cognitive maps (see Figure 3.1 and also Chapter Four) were constructed for, and from, individual company monographs and material supporting these monographs. The maps mapped the strategic thinking behind the development of new technologies and also the corporate thinking of the companies on environmental sustainability. Good examples of these maps maybe found in the Monsanto Monograph (Chataway and Tait, 2000).
Behind PITA was the notion that technological innovation in the agrochemicals, biotechnology and seeds industries has the potential to deliver more socially and environmentally sustainable farming systems. However, although a range of European policies could contribute to these outcomes, in practice they often counteract one another. The PITA project conducted an integrated analysis of policies and market-related factors and investigated their impact on the strategies and decision making of companies (multinationals and small and medium enterprises) and public sector research establishments. It also considered the implications of these decisions for employment, competitiveness and environmental benefits in Europe. The overall aim of the project was to contribute to the development of sustainable industrial and farming systems and an improved quality of life by encouraging the development and uptake of ‘cleaner’ technology for intensive agriculture (see Tait et al, 2001).
Monographs and maps
A focus on technology strategies and trajectories allowed us, in our detailed study of 14 major multinational companies (including seven of the top ten global agro-chemicals and seeds companies), to consider the drivers that influence innovation from the perspectives of the companies. We found cognitive mapping to be useful for highlighting the thinking of key actors in decision making about new technologies and this was used as a key form of analysis.
Cognitions may be described as the belief systems used by individuals to perceive, construct and make sense of their world (Swan, 1997). The term ‘cognitive mapping’ is used to describe a set of qualitative modelling techniques that attempt to portray these cognitions. The particular technique used for this project was developed by Eden (1989) and is based on Kelly’s Personal Construct theory (Kelly, 1995 [1955]). The technique has since been developed and used extensively in consultancy situations, particularly for mapping strategic thinking in companies (see, for example, Huff and Jenkins, 2002). It is designed to capture in a diagram the thinking on a particular issue of an individual or an organisation. Eden and Ackerman (1998) argue that it is not meant to be a precise model of cognition, but rather a technique that translates Kelly’s theory into a useful tool enabling the representation of the part of the person’s (or organisation’s) construct system that they are willing or able to reveal.
Cognitive maps have the advantage of enabling links between concepts to be made to illuminate on the reasoning behind an issue. They can highlight the importance of particular beliefs within a view, that is by showing which concepts have highly developed reasoning behind them. The maps do not assume a linear model of reasoning from worldview through to specific beliefs and then actions: they do not assume that beliefs are necessarily hierarchical – some may appear further down the diagram as a result of specific actions or instruments. Reinforcing mechanisms can be identified through feedback loops. Each cognitive frame (perspective) can be set out on one sheet of paper (see Figure 3.1).
The main advantages of using the cognitive mapping technique for analysis within the PITA project were that they:
• provided a way of presenting the individual researcher’s analysis to a large team, making the large amount of information more accessible;
• provided useful reminders of the contents of each monograph;
• captured the essence of a company’s world view through highlighting connections between aspects such as innovation, markets, and so on;
• established the relationships between aspects of thinking;
• enabled comparisons to be made between and across the companies;
• through the links between concepts, highlighted aspects of the companies’ views that may not be immediately obvious when reading the monograph;
• highlighted the differences in individuals views when mapping the interviews; and
• identified strands of thinking and clusters of concepts which represent key themes.
There are, however, potential difficulties with them in that links may not always be that clear, therefore the researcher may be making assumptions about links. The maps present the drawer’s particular view of the situation, participants’ reflections on the maps are therefore important, and the maps can be used as a basis for discussion, as noted in Chapter Two. Also, the maps can get complicated at the lower level of detail – separate maps may be drawn to get round this.
For the overall project analysis, four or five cognitive maps were produced for each company using the material collected, for example from interviews or company information, or produced in monographs written for each company. These researcher produced maps provided a foundation for further higher level integrated analysis to be carried out by the research team. They presented each company’s thinking on key aspects of concern in the PITA project – innovation, policy and environmental sustainability. Overview maps attempted to provide an overview of a company’s strategic thinking and to capture the essence of that company’s worldview, while the cognitive maps drawn directly from interviews with company representatives resulted in maps depicting personal views held by key decisions makers within their organisation. Thus the maps described the company’s self-perceptions as perceived by the researcher or author of the monograph and represent a snapshot, at a particular moment in time, of the worldview of a particular company.
While it is possible to draw the maps by hand, and this may be particularly useful in an interview situation, the large number of maps generated by the project were produced using the computer software Decision Explorer. This software was developed specifically for capturing and exploring the complexity of qualitative information and may be used in groups, such as workshop situations, as well as individually. The software enables the mapping of concepts and the relationships between them and can be used to explore different perspectives on complex issues. As cognitive mapping techniques do not represent mental models in the psychological sense and data collection (such as interviewing techniques) can influence what is revealed, each monograph, together with the maps, was sent to the company concerned for comments and to ensure their views were being accurately portrayed.
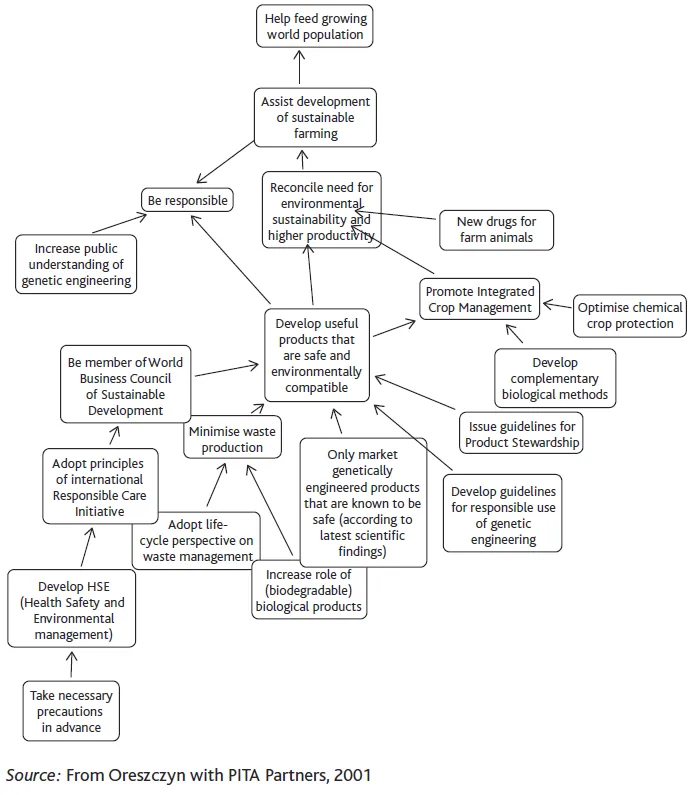
Figure 3.1 shows one example of the many maps drawn during the course of the project. This example focused on the environmental elements of concern to one major multinational company based mainly in Europe. We found that European companies were more dependent on the European context and were more sensitive to European political and regulatory cultures, including the more active stakeholder approach demanded by European citizens.
As you can see, the maps consist of concepts linked by arrows or lines. Links describe relationships between concepts. Along with the concepts, they form a line of argument, a description of a problem or the components of a strategy. A concept is expressed as a short statement covering a single idea or notion, for example assertions about part of a strategy, causes of a problem or means of improving a situation. The links between concepts can cover a range of different types of relationship, causal, connotative or temporal. They may also be positive or negative. The statements, or concepts at the top of the maps represent the company’s aspirations or goals, with strategies for achieving these goals represented below them.
Figure 3.1: Example of a company’s cognitive map from the PITA project
Findings and reflections
The maps generated a wealth of data and findings and these may be found in the project documents. One example relevant here is the maps revealed the way that almost all the companies in our sample had used the concept of sustainability to describe their vision of the interactions between agriculture and the environment. Underlying this view was the notion that new innovations were important for feeding a growing world population while at the same time protecting biodiversity. They felt they were making a contribution to the sustainability of farming systems as their whole crop strategies supported high yielding agriculture while at the same time reducing pesticide use and developing ‘cleaner’ pesticides. This was their particular view at the time and others, such as environmental groups, viewed things differently. Therefore, an important feature of cognitive maps for contentious environmental issues is that they can help diverse groups of people with different views understand the thinking behind others’ views. They demonstrate the complexity and level of sophistication of thinking behind people’s beliefs. They help avoid presenting people’s views as for and against positions, which can be over simplistic and misleading. They point to why particular positions taken by people regarding a particular issue are as they are and might be difficult to move, but also indicate where minds might meet to find ways forward.
The maps were particularly useful for setting particular views or strategies of the companies within their wider context. A company’s view on environmental sustainability formed just one aspect of their thinking. What the maps were able to reveal was how their thinking on the environment linked in with their thinking about research strategies more generally and also the wider company view. Interestingly each company had a very particular worldview, often associated with their particular kind of leadership. Presenting the maps back to the companies can provoke interesting conversations around how they view themselves as well as ens...