Research doesn't exist in a bubble but co-exists with a multitude of other tasks and commitments, yet there is more need for people to save time than ever before. Brilliantly attuned to the demands placed on researchers, this book considers how students, academics and professionals alike can save time and stress without compromising the quality of their research or its outcomes. Including a new foreword by Patrick Sturgis, Director of UK National Centre for Research Methods, this second edition is fully revised. It provides a new chapter on methodologies covering a range of approaches, and a wealth of updated practical information. Each chapter concludes with annotated further readings and the volume is accompanied by a fully revised and updated companion website. This supportive book is designed for any student or practitioner who wants to know how to do research on top of their main job and still have a life.
- 256 pages
- English
- ePUB (mobile friendly)
- Available on iOS & Android
eBook - ePub
About this book
Trusted by 375,005 students
Access to over 1.5 million titles for a fair monthly price.
Study more efficiently using our study tools.
Information
NINE
Data analysis
Introduction
When you have collected all your data, you need to analyse it; to find a way to understand what it can tell you. This is both one of the most challenging and one of the most rewarding parts of the research or evaluation process.
One of the people I interviewed for this book said that they found data analysis to be the easiest part of the research process. Another said quantitative data analysis was the easiest. On the other hand, four said that for them, data analysis was the hardest part of the research process. Also, two of the interviewees who teach novice researchers commented that new researchers often find data analysis to be one of the most difficult parts of the process.
Starting to work with your data can feel quite daunting.
You’ve got it all, you’ve got this great mountain of stuff and then it’s ‘OK, what do I do with it now?’ This is all very interesting, but what do you do with it? I didn’t have a computer program or anything like that, so it was your highlighter pen and your cut-and-paste to get things into categories. How was I deciding how to get things into categories? Was it what people said? If some of them said ‘integrated working’, did they all mean the same thing or something different?
Even if your own data is mostly quantitative or mostly qualitative, you need to understand the principles of data analysis for both types of research. This chapter will cover each approach separately before looking at how to cross-analyse and synthesise different datasets. I would urge you to read the sections on both quantitative and qualitative data, even if you feel a definite antipathy to one or the other. This is because you will need to understand both kinds of data analysis to be able to read critically reports of quantitative, qualitative, and mixed-methods research.
Data preparation
Before you can analyse your data, you will need to prepare it for analysis. How you do this depends on the form of your data. For example, data from a pile of handwritten questionnaires with numeric answers, such as from rating scales, would need to be collated by hand or entered into a computer application such as Microsoft Excel, StatsDirect or SPSS (see below for more on these).
Audio data from interviews or focus groups would need to be transcribed. This is a laborious task, and one shortcut could be to outsource the transcription of your data. However, I would advise against this. The process of data preparation, although tedious, does help to familiarise you with your data.
Be prepared to transcribe the data yourself. It is time-consuming but you will understand the breadth and depth of what is being studied.
It’s the going back over the interviews when you’re listening to them that really helps. That’s when you start to pick up on the connections, the differences or similarities, the further questions you want to ask – so in the end it helps to make it quite interesting.
When transcribing, it helps to have a pedal to operate your audio software, to leave your hands free for typing. There are dozens of options, with many (at the time of writing) priced between US$50–100. If you search the internet for ‘foot pedals for transcription’ you will find the latest models and prices. Another option is to use voice recognition software such as Dragon or the open source CMU Sphinx. This kind of software will ‘train’ itself to your voice, though you will need to speak slowly and clearly. This means it will not transcribe accurately from your audio data itself, especially if you have conducted focus groups. However, it does enable you to transcribe by repeating rather than typing the data. If you are a slow typist, or have any problems with your hands, voice recognition software can be a great asset.
Some software products, such as NVivo, let you import your audio files and code them directly. This saves time, but one drawback is that you can’t then use text search functions to supplement your coding, which can be very useful during analysis (see below for more on this).
Pictorial data would need to be converted into text for thematic analysis, whether by hand or using computer software such as Microsoft Word (for a PC) or Apple Pages (for a Mac). Alternatively, the data could be scanned, and loaded into a computer application which facilitates analysis of visual data such as NVivo. If you are analysing visual data by hand, it may be easier if you can create electronic copies of any images you have only in hard copy, and then enlarge them before printing them out. This will give you more room to code and annotate each image. If your images are very rich in content, you may need two or more print-outs of each one, which can then be used to analyse different features of the image. Another helpful tool for analysis by hand is the metadata record, similar to the literature grids discussed in Chapter Six. As with those grids, you would need to devise your own metadata record to meet your particular needs. For example, if you were using photographs as data, you might create a metadata record like the one shown in Figure 9.1.
Figure 9.1: Metadata record for photographic data
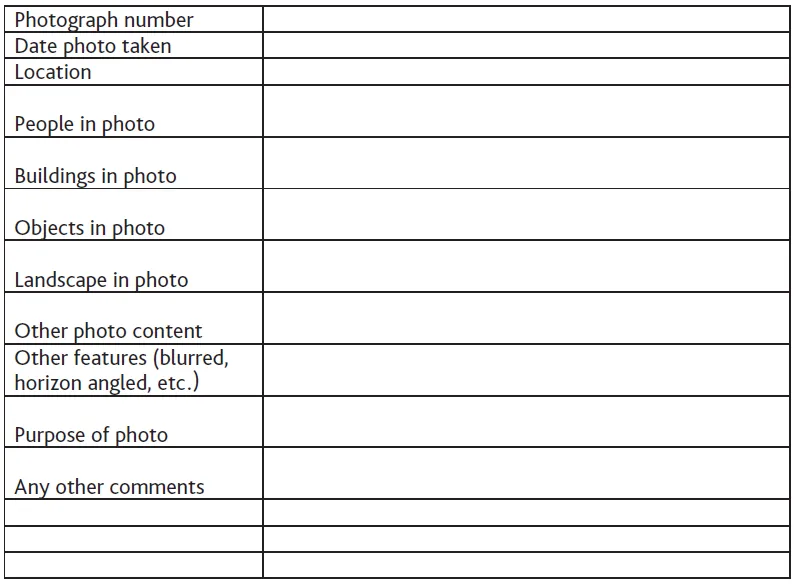
Then you can use one metadata record for each photo, which will help you to compare and contrast the significant features of your data. You can see that I have left some blank rows at the end of the metadata record, which is good practice as you may think of significant features as you work through your data preparation which you didn’t consider at the start. I expect you realise that this system would also work with documents, interviews, and so on.

Create and use your record sheets electronically to save time at the analysis stage.
Data preparation can be surprisingly time-consuming.
You have to spend quite a bit of time getting the data ready for analysis, so you need to build in time for that. The focus groups had to be transcribed, and I didn’t get any admin support or resources for that, that was me and actually transcribing everything took a month. That was a month I didn’t anticipate, which is stupid because I should have thought about it.
As far as possible, prepare your data as you collect it.
Although it is time-consuming, data preparation is one of the research tasks which can easily be done in small bite-sized chunks. Even five spare minutes can be usefully spent in collating figures, entering data onto a spreadsheet, transcribing audio data or scanning pictures. Also, data preparation is one of the most boring parts of any research project, so setting aside a whole day for it can leave you feeling ready to jump off the nearest cliff by lunchtime. Boredom leaves you vulnerable to making mistakes or poor decisions, so try to interleave your data preparation with more interesting tasks. And remember, the end result will be worth the effort.
It is essential to be meticulous about the accuracy of your data preparation. To err is human, so it is worth putting in place some safeguards. However you prepare your data, you need an easy way to trace your collated or transcribed data back to the source. One implication of this is the need to preserve your original data, in its original form, at least until your research or evaluation project is finished. Then, when you are analysing your data, if you think you may have found an error, you can go back to the original data and check. Of course, how you do this will depend on the type of data you have collected. For example, if you have questionnaires, number each one before you start collating your data, and make sure each entry in your handwritten lists or spreadsheet rows is linked to the number of the individual questionnaire. Alternatively, if you are transcribing audio data, it is helpful to put a note in the transcript at regular intervals, say every one or two minutes, of the amount of the recording you have transcribed. This way, if you need to check for accuracy, you can find the relevant section of the recording quickly and easily.
It can also be helpful to be aware of the types of error you might make. Some common errors which occur when preparing data are:
• Errors of omission – leaving something out;
• Errors of commission – putting something in which shouldn’t be there;
• Errors of transposition – putting two numbers, letters, or words in the wrong order;
• Misreading errors – reading something incorrectly;
• Substitution errors – writing something incorrectly;
• Typographical errors – reading correctly and intending to write it correctly, but accidentally pressing the wrong key on a keyboard.
In an extreme scenario a single error could completely change your findings. For example, when working with numerical data, a misplaced zero can cause a factor of 10 error. Putting the decimal point in the wrong place can also be a very big mistake. With handwritten numbers, it can be easy to confuse a 1 with a 7; with typewritten numbers, it can be easy to misread, say, 78332 as 78832.
When working with textual data, the substitution of just one letter can cause a dramatic change of meaning. Consider this interview excerpt:
‘I told my precious wife I loved her.’
An error could be made here by misreading, or substitution, or through a ‘typo’ as the character C is next to the V on a QWERTY keyboard:
‘I told my previous wife I loved her.’
Or:
‘I was only kidding him.’
The D is next to the S…
‘I was only kissing him.’
And, of course, these kinds of errors will not be detected by a computer spell-checker. Similar errors can easily be made with handwriting, too, especially when you’re reading writing which isn’t clear, or if you’re writing in a hurry yourself (or if your handwriting, like mine, resembles the scrawl of a demented gibbon).
Take great car...
Table of contents
- Cover
- Title Page
- Copyright
- Dedication
- Contents
- List of figures, tables and boxes
- About the author
- Acknowledgements
- Foreword
- ONE: Introduction
- TWO: Overview of research
- THREE: Methodologies, approaches, and theories
- FOUR: Topics and proposals
- FIVE: Managing your research or evaluation project
- SIX: Background research
- SEVEN: Secondary data
- EIGHT: Primary data
- NINE: Data analysis
- TEN: Writing for research and evaluation
- ELEVEN: Disseminating research and evaluation
- TWELVE: Conclusion
- Appendix One: Job titles of interviewees
- Appendix Two: Sample record-keeping grid
- Appendix Three: Exchanging information electronicallya
- Appendix Four: Ethical codes from different disciplines and countries
- Glossary
- Bibliography
Frequently asked questions
Yes, you can cancel anytime from the Subscription tab in your account settings on the Perlego website. Your subscription will stay active until the end of your current billing period. Learn how to cancel your subscription
No, books cannot be downloaded as external files, such as PDFs, for use outside of Perlego. However, you can download books within the Perlego app for offline reading on mobile or tablet. Learn how to download books offline
Perlego offers two plans: Essential and Complete
- Essential is ideal for learners and professionals who enjoy exploring a wide range of subjects. Access the Essential Library with 800,000+ trusted titles and best-sellers across business, personal growth, and the humanities. Includes unlimited reading time and Standard Read Aloud voice.
- Complete: Perfect for advanced learners and researchers needing full, unrestricted access. Unlock 1.5M+ books across hundreds of subjects, including academic and specialized titles. The Complete Plan also includes advanced features like Premium Read Aloud and Research Assistant.
We are an online textbook subscription service, where you can get access to an entire online library for less than the price of a single book per month. With over 1.5 million books across 990+ topics, we’ve got you covered! Learn about our mission
Look out for the read-aloud symbol on your next book to see if you can listen to it. The read-aloud tool reads text aloud for you, highlighting the text as it is being read. You can pause it, speed it up and slow it down. Learn more about Read Aloud
Yes! You can use the Perlego app on both iOS and Android devices to read anytime, anywhere — even offline. Perfect for commutes or when you’re on the go.
Please note we cannot support devices running on iOS 13 and Android 7 or earlier. Learn more about using the app
Please note we cannot support devices running on iOS 13 and Android 7 or earlier. Learn more about using the app
Yes, you can access Research & Evaluation for Busy Students and Practitioners 2e by Kara, Helen in PDF and/or ePUB format, as well as other popular books in Scienze sociali & Metodologia e ricerca nelle scienze sociali. We have over 1.5 million books available in our catalogue for you to explore.