![]() Part One
Part One
Dimensions of policy and outcomes![]()
TWO
Poverty, inequality and redistribution
Tom Sefton, John Hills and Holly Sutherland
Introduction
The previous Conservative government presided over a period of sharply rising income inequality: between 1979 and 1996-97, the median income of the richest tenth increased by more than 60% in real terms, but that of the poorest tenth rose by just 11% (or fell by 13% if incomes are measured after housing costs). Ultimately, many people’s judgement of New Labour will rest on whether it has made progress towards reversing this trend towards greater inequality. This chapter focuses specifically on what has happened to income inequality and poverty and on the impact of the government’s tax-benefit and spending policies, which are its most direct instrument for influencing the distribution of incomes.
New Labour’s emphasis has been firmly on raising the living standards of the poorest, encapsulated in Blair’s historic pledge in 1999 to end child poverty within a generation, rather than on seeking to reduce income inequality. Poverty was, however, to be defined in relative terms – and specifically in relation to median income, which rises over time in line with living standards in the rest of society. Although New Labour has rarely emphasised the redistributive impact of its tax-benefit policies, these have always been a vital component of its anti-poverty strategy in combination with a range of other policies designed to improve the life chances of the poorest, including the early years agenda, targeted measures to raise educational standards in the most deprived neighbourhoods, and welfare-to-work programmes (see Chapters Three, Four and Five).
New Labour’s tax-benefit policies
From 1998, every Budget has included a section on ‘building a fairer society’ (or variants of this) from which it is possible to identify a fairly consistent set of principles underpinning the government’s efforts to tackle poverty through the tax-benefit system. The first theme is work as the best route out of poverty and, therefore, the need to ensure that work pays. In its first Budget, New Labour announced its intention to introduce a National Minimum Wage (which came into effect in April 1999) as well as a more generous system of in-work tax credits for low-paid workers. The Working Families’ Tax Credit (WFTC) replaced Family Credit in 1999 for families with children (with much higher maximum awards and a more gradual taper) and was itself replaced by the Child Tax Credit (CTC) and Working Tax Credit (WTC) in 2003, which created a more integrated system of financial support for children and extended in-work benefits to families without children (though at a lower rate). Early changes in Income Tax were also designed to favour low earners, including a new 10 pence tax band and the removal of the entry charge for National Insurance contributions (both in 1999). The abolition of the 10 pence tax band in April 2008 was clearly a step in the opposite direction and only partially compensated for by increased tax credits and (at great cost) by the reactive increase in personal allowances announced in May 2008.
Another theme of New Labour’s Budgets that emerged very early on was the strong emphasis on supporting families with children in recognition of the ‘costs and responsibilities which come with parenthood’ and the impact of child poverty on eventual adult outcomes. Financial support for children was initially to be built on universal Child Benefit (which was increased substantially for first or only children in 1999), but with extra resources targeted at families on low incomes in and out of work, largely through the tax credits system. The Married Couple’s Allowance and its equivalent for lone parents were replaced by the Children’s Tax Credit and then by the family element of the CTC, which were worth around twice as much as the Married Couple’s Allowance, but restricted to families with children and tapered away for those on incomes taxed at the top rate. This approach was described as ‘progressive universalism’, giving (almost) everyone a stake in the system while offering more help to those who need it most. In practice, the progressivity of tax-benefit reforms has been more evident than their universalism, with most of the increase in child-contingent support concentrated on the income-related elements, presumably to maximise the impact on child poverty. One policy that went the other way was the decision to go ahead with the Conservative’s plans to phase out One Parent Benefit and lone-parent premiums (1998), although lone parents have benefited substantially from subsequent increases in child-related benefits and tax credits.
A specific feature of the government’s tax-benefit reforms has been the use of selective benefits to help parents or children at key stages, including more generous maternity grants (in 1999), higher and extended Statutory Maternity Pay (2002 and 2003 in particular), higher tax credits for families in the first year of their child’s birth (2002) and higher benefits for parents with severely disabled children (from 2001). More recently, older children have been targeted with Education Maintenance Allowances (nationwide from 2004) and more generous benefits (2006) for those continuing in education and training. The cost of these measures is relatively small, but their impact is potentially significant for certain target groups.
A third objective has been to ‘help pensioners share in the prosperity of the nation’. As with children, the emphasis has been on helping the poorest pensioners, with large increases in Income Support for older people (renamed Minimum Income Guarantee in 1999 and then Pension Credit in 2003). The Savings Credit element of the Pension Credit extended support to many more pensioners with moderate incomes and savings. Apart from a step increase in the universal Basic State Pension in April 2001 (in response to the outcry over the 25 pence increase in the previous year), the Basic State Pension has risen broadly in line with prices (although with a commitment to earnings indexation probably from 2012). But, the government has introduced various universal cash payments and in-kind benefits for pensioners, including Winter Fuel Payments (introduced in 1999 and now worth up to £400 per year), free eye tests (1999), free television licences for those aged 75 or over (2001) and free local and nationwide bus travel (2006 and 2008 respectively). The government has also made several one-off payments, mainly to older pensioners, to help with their Council Tax bills (2003-04 to 2005-06 and again in 2008-09). In addition, age-related personal allowances have been raised by more than indexation, initially to compensate pensioners for the removal of the Married Couple’s Allowance, but then as a stated policy to remove more pensioners from Income Tax.
The government has identified people with disabilities as a priority group in some Budgets and introduced the Disability Income Guarantee in 2001 to provide greater security for people with severe disabilities who cannot work. But the additional cost of this and other measures is very small by comparison with those targeted at children and pensioners – and, in its first year, the government implemented rules that made Incapacity Benefit less generous for some people receiving occupational pensions. For most working-age adults without children, benefits have only been raised in line with prices.
Taxation policy has not been used explicitly to redistribute incomes other than through tax credits. Through the period we cover, government kept its manifesto commitment not to raise the higher rate of Income Tax, although changes to National Insurance contributions have been progressive, including the additional 1% contribution rate on earnings above the Upper Earnings Limit (in 2003) and the step increase in the Upper Earnings Limit (in 2008).1 But, other measures have been highly regressive, in particular changes in the taxation of capital gains in 1998 (only partly redressed in 2008) and higher and now transferable Inheritance Tax allowances (from 2005 onwards), both of which were of greatest benefit to the wealthiest individuals. In monetary terms, the most significant changes to direct taxation were the cuts in the basic rate of Income Tax from 23% to 22% (in 2000) and to 20% (in 2008), which disproportionately favoured middle- and higher-income groups.
Last, but not least, successive Budgets have emphasised the need to ensure that everyone has access to high-quality public services as an important component of the anti-poverty strategy. It is important, therefore, to consider the overall redistributive impact of fiscal policy, which we do later in the chapter.
Changes in inequality and poverty under New Labour
Trends in inequality
As in most studies of inequality and poverty, our analysis focuses on snapshots of the income distribution at different points in time. So, for example, we compare the incomes of those in the poorest tenth of households at the beginning of the period with the poorest tenth of households at the end of the period, while recognising that these are not the same people in both years. There is, however, good evidence that cross-sectional income inequality mirrors other more dynamic measures of inequality, such as lifetime income inequality and intergenerational income mobility (Esping-Andersen, 2005).
Most of the analysis presented in this chapter is based on the official Households Below Average Income (HBAI) dataset, which consists of a representative sample of UK households (DWP, 2008a). The income measure covers all the main sources of income, including earnings and state benefits, net of direct taxes and adjusted for differences in household composition. It does not include the value of benefits in kind from free or subsidised services or the effect of certain tax reforms, such as changes in capital gains taxation or Inheritance Tax. The latest HBAI publication covers the period up to 2006-07. Later in this chapter, we use a tax-benefit model to simulate the impact of government policies up to 2008-09.
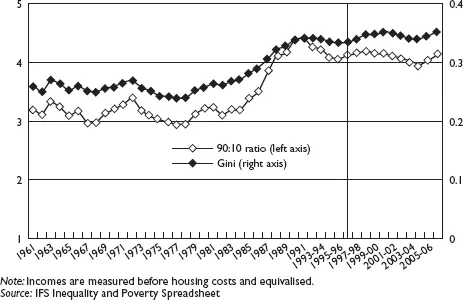
Looking at the long-term picture, income inequality has been relatively flat since the early 1990s, but remains high by historical standards (see Figure 2.1). On the most common measures, there has been a small and statistically significant rise in the Gini coefficient between 1996-97 and 2006-07 and no significant change in the ratio between the incomes of those 10% from the top and those 10% from the bottom (Brewer et al, 2008a). Inequality did fall on both measures for three consecutive years between 2000-01 and 2003-04, but rose in the two most recent years.
Figure 2.1: Changes in overall income inequality, 1961 to 2006-07
Across most of the distribution, however, incomes have become more equally distributed in the last 10 years, so this is very different to what happened in the 1980s when incomes diverged across the whole distribution. On average, the real growth in the incomes of the second decile group was greater over this period than that of the ninth decile (see Figure 2.2). The small increase in overall ineq...