![]()
From the Crisis of Distribution to the Distribution of the Costs of the Crisis
Özlem Onaran
The aim of this chapter is to analyze the possible distributional consequences of the global crisis based on the lessons from the experiences of past crises. While public policy in the advanced capitalist countries concentrated on arresting the credit crash since the onset of the crisis in the summer of 2007, the effects of the crisis on the real sector has attracted the attention of policymakers since as late as the winter of 2008. Although finally, some concern about the effects of the crisis on employment is visible, distributional consequences are still not on the agenda of policymakers.
The failure to recognize the distributional aspects of the crisis in the policy reactions is no coincidence, when the mainstream analyses about the reasons for the crisis are factored in (for example, the International Monetary Fund [IMF] 2008; Organisation for Economic Co-operation and Development [OECD] 2008; European Central Bank [ECB] 2008), such analyses often portraying the crisis as a banking and financial sector crisis with implications for the real sector. However, this analysis misses the important structural reasons behind the crisis, which are related to the neoliberal macroeconomic policy choices of the post-1980s and the major redistribution of income at the expense of labour as a consequence. Even if the European Commission (2007) is finally pointing at the falling wage share in Europe and other advanced countries, it fails to connect this deterioration in the labour share to the crisis and handles the issue as a separate problem, mostly related to skill-biased technological change. Among the international institutions, the International Labour Organization (2008) is the only exception to have established the link between crisis and distribution. The operation of neoliberal policies and the deterioration in labour share, together with risky developments in credit, housing and security markets, have created a significantly fertile ground to sow the seeds of a major global crisis. Thus, what we are going through is a crisis of distribution, and similarly, policy reactions to the crisis are part of a distributional struggle, even if it is not named so. This also explains why the international as well as national institutions reacted to the accumulating risks only after they turned into a full-fledged crisis. Although the profits of this fragile growth regime were privatized, the losses and risks are now being socialized. What we understand from the socialization of the costs, is not only the use of the working peoples’ tax money for generous bail-out packages for the crisis-ridden or bankrupt institutions in a narrow sense, but also the broader consequences of the crisis on income distribution.
The following section discusses the distributional background of the crisis with a focus on the labour share and the functional distribution of income. Section three presents the effects of the past crises in developing countries and in Japan on income distribution and unemployment. Building on these lessons, section four discusses the possible effects of the current global crisis in different countries. Section five concludes with policy implications.
The Crisis of Neoliberalism
Since the 1980s, the world economy has been guided by neoliberal economic policies such as the dismantling of government regulations in financial markets as well as in goods and labour markets, and the increased openness of economies to trade, foreign direct investment (FDI) and financial capital flows. These policies have reduced the role for macroeconomic policy interventions with the claim that free market capitalism would increase efficiency and growth, and provide a fair distribution of income. The focus of macroeconomic policy has shifted away from full employment towards mere price stability. The outcome was a secular deterioration in the labour share since the early 1980s.
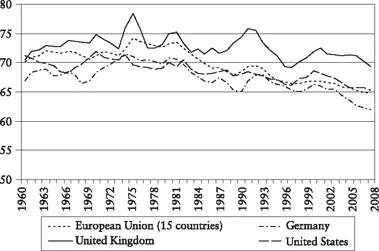
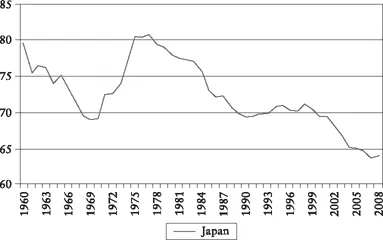
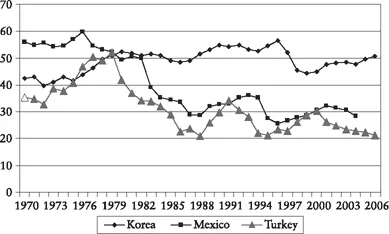
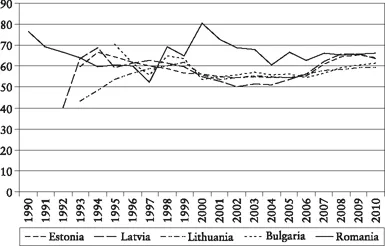
Figure 1.1–1.7 shows the decline in labour share in major, advanced capitalist countries, countries of Eastern Europe and selected developing countries. There is a continuous decline in the labour share across the globe, ranging from developed countries to major emerging economies of Latin America, Asia and Eastern Europe, all of which have shared similar neoliberal policy guidelines. In the last few years, the Baltic countries and the Czech Republic, where the labour share has risen back to its former peak at the start of the transition to capitalism, stand out as exceptions. However, wage share data do not allow us to compare the current situation of these countries with that in the pre-transition phase; moreover, it is well possible that the pace of recovery cannot be maintained during the current crisis. Although this global trend of decline in labour share is very striking, these numbers in Figure 1.1–1.7 are hiding another important fact: the very high wages of the chief executive officers (CEOs) or other top-ranking managers are also part of labour income, and the share of these high-income groups in total labour income has increased dramatically at the expense of the rest of the wage-earners in the last two decades (ILO 2008). For example in the US, the real hourly compensation of the production and nonsupervisory workers, who constitute 85 per cent of the labour force in the country, has been stagnating since the 1980s despite significant gains in productivity (Palley 2008). Median real wages grew only by 0.3 per cent per year during 2000–06, while labour productivity increased by 2.5 per cent per year (ILO 2008).
Figure 1.1: Adjusted wage share of total economy in EU & US
Note: Compensation per employee/GDP at factor cost per person employed, per cent.
Source: AMECO, online macroeconomic database of the European Commission’s Directorate General for Economic and Financial Affairs.
Figure 1.2: Adjusted wage share of total economy in Japan
Note: Compensation per employee/GDP at factor cost per person employed, per cent.
Source: AMECO, online macroeconomic database of the European Commission’s Directorate General for Economic and Financial Affairs.
Figure 1.3: Wage share in manufacturing industry: Korea, Mexico, Turkey (per cent)
Source: OECD STAN for Korea and Mexico and for Turkey Annual Survey of Employment, Payments, Production and Tendencies in Manufacturing Industry by the Turkey Institute of Statistics.
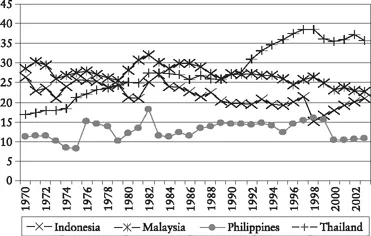
Figure 1.4: Wage share in manufacturing industry: Indonesia, Malaysia, Philippines (per cent)
Source: For Brazil, Philippines and Thailand, the UN manufacturing data is combined with the World Development Indicator (WDI) database of 1993, which report manufacturing wages and employment, and for Argentina, Indonesia and Malaysia WDI data is combined with the Economic Intelligence (EIU) database based on percentage changes.
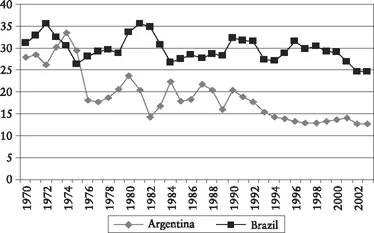
Figure 1.5: Wage share in manufacturing industry: Argentina, Brazil (per cent)
Source: For Brazil, Philippines and Thailand, the UN manufacturing data is combined with the World Development Indicator (WDI) database of 1993, which report manufacturing wages and employment, and for Argentina, Indonesia and Malaysia WDI data is combined with the Economic Intelligence (EIU) database based on percentage changes.
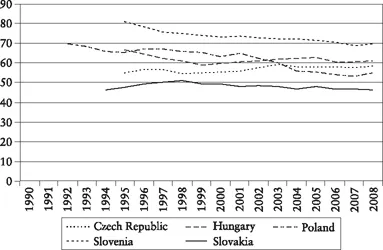
Figure 1.6: Adjusted wage share of total economy in Eastern Europe
Note: Compensation per employee/GDP at factor cost per person employed, per cent.
Source: AMECO, online macroeconomic database of the European Commission’s Directorate General for Economic and Financial Affairs.
Figure 1.7: Adjusted wage share, total economy in Baltic countries
Note: Compensation per employee/GDP at factor cost per person employed, per cent.
Source: AMECO, online macroeconomic database of the European Commission’s Directorate General for Economic and Financial Affairs.
The increase in globalization, in particular the mobility of capital and the stagnation in aggregate demand have been the chief factors behind this pro-capital redistribution of income (Onaran 2008a and 2008b). The stagnation in demand has led to higher rate of unemployment and eroded the bargaining power of labour vis-á-vis capital. In the meantime, the increase in mobility of capital has not only contributed to this erosion in the bargaining power of labour, but has also increased the fragility à la Hyman Minsky built in the capitalist system via increased financialization and speculation. Therefore, there have been more crises in the post-1980s than in the 1970s (Laeven and Valencia 2008). Financialization, coupled with tight fiscal and monetary policies as well as a decrease in the labour share in income, has set the conditions for a vicious cycle of deficient aggregate demand, low growth, low employment and a crisis-prone global economy.
Herein lie the two important long-term contradictions of neo-liberalism. First, laissez-faire capitalism has generated higher profits for multinational firms, especially those in the financial sector. However, such high financial returns have replaced profits from real activity in many cases. As this finance-dominated regime rose to the ascendant, investment behaviour of the firms in the economy as a whole was significantly affected by rising shareholder value-orientation. Lazonick and O’Sullivan (2000) argue that a shift in management behaviour from ‘retain and reinvest’ to ‘downsize and distribute’ has occurred. Financial-market-oriented remuneration schemes based on short-term profitability have increased the orientation of management towards shareholders’ objectives. The unregulated financial markets and the pressure of financial market investors have created a bias in favour of asset purchases as opposed to asset creation. At the same time, most of the efforts of macroeconomic policymakers have been spent in framing policies that would retain the investor confidence of volatile financial markets. Markets have been deregulated mainly to support the interests of the rentier-capitalists, who have continued benefiting from investment subsidies, tax concessions and bail-out packages during crises. The same process has limited the bargaining power of workers. In a way, the fall in labour’s share in income has prevented the profits in the real sector from being eroded by increased interest payments. Consequently, the relationship between profits and investments has changed; the investment–profit ratio shows a clear declining trend and thereby higher profits do not automatically lead to higher investment. Thus, in spite of higher profit rates, not only in the US, but also in major advanced capitalist economies (Germany, France and the UK), as well as some developing countries (for example, Latin America and Turkey), economic growth rates have been well below their past ones.
Second, from a macroeconomic perspective, the decline in labour share has also been a problem for the microlevel beneficiaries of these neoliberal policies. Profits can only be realized if there is sufficient and effective aggregate demand for goods and services. But the decline in purchasing power of labour has had a negative effect on consumption, given that the marginal propensity to consume out of profits as well as rentier income is lower than that out of wages. This negatively affects investments, which are already under the pressure of shareholder value orientation.
Exactly at this critical juncture, financial innovations seemed to have offered a short-term solution to the crisis of neoliberalism in the 1990s in the form of debt-led consumption growth. It is important to note that without unequal income distribution, the debt-led growth model would not have been necessary or possible. Particularly in the US, but also in the UK, Ireland, or even some continental European countries like the Netherlands and Denmark, household debt increased dramatically over the last decade. The increases in housing credits and house prices fuelled each other. Then, the increased housing wealth, thanks to the housing bubble, served as collateral for further credit and fuelled cons...