Research on human cognitive abilities has a long history in psychology and education, and has been widely applied to practical problems in schools, clinics, and employment settings. This book explores the historical background and current views of how human intelligence manifests itself in real-world contexts.
eBook - ePub
Human Cognitive Abilities in Theory and Practice
- 368 pages
- English
- ePUB (mobile friendly)
- Available on iOS & Android
eBook - ePub
Human Cognitive Abilities in Theory and Practice
About this book
Trusted by 375,005 students
Access to over 1.5 million titles for a fair monthly price.
Study more efficiently using our study tools.
Information
Subtopic
Mental Health in PsychologyIndex
PsychologyIII
POSTER SESSION PAPERS
8
Contemporary Statistical Models for Examining Test Bias
University of Virginia
One of the most controversial aspects of research on human cognitive abilities emerges in studies of group differences. Controversy arises whenever group differences are found using psychological measurements, especially when interpretations are made about the likely sources of these differences. The popular terms test fairness, cultural fairness, and test bias refer to fundamental problems in measuring group differences between majority and minority groups. The controversies surrounding these issues can lead to a variety of social and political problems for both the research and the researcher (e.g., Husén, 1978; Scarr, 1981, 1988; Snyderman & Rothman, 1990).
There are many definitions of test bias and the differences among these definitions remain unclear and are often confused (see Berk, 1982; Bond, 1994; Cole, 1981; Flaugher, 1978; Hartigan, 1990; Linn, 1984; Reynolds & Brown, 1984). But the broad scientific question raised here is a fundamental one: To what degree are the observed group differences reflections of real underlying psychological processes, and to what degree are these difference reflections of the way the psychological tests were constructed? This is a fundamental question in psychological measurement and, because it is directly related to issues of “fairness or unfairness,” it is also an issue of major importance in public policy debates.
In 1989 my colleagues and I began examining these questions using several current models of test bias applied to academic data collected on college student-athletes. In this statistical research we focused on a critical question: How can we properly evaluate the fairness or unfairness of new academic rules for initial eligibility to participate in college sports programs? In carrying out this research, we created a set of summary statistics and models which have been considered key evidence in public policy debates (see NCAA, 1991a, 1991b, 1991c, 1992). Selected aspects of these data are presented briefly here. Four kinds of models of test bias are defined and applied to these data, including bias due to (a) sampling, (b) selection, (c) prediction, and (d) measurement. The results of each analyses are summarized, and some limitations and advantages of each approach are discussed.
These contemporary statistical modeling methods offer useful possibilities for the objective scientific research, and scientific objectivity can be critical in many public policy debates. Scientific results are often selectively used by advocates to support a prespecified position, and there is a need to further define the appropriate relationship between the research and the researcher (e.g., Campbell, 1988; Coleman, 1990; Cronbach, 1976; Husén, 1978). One broad goal of this chapter is to encourage more work toward an appropriate balance of both objective and subjective issues.
A Contemporary Model of Test Bias
The term test bias is used here to denote a type of modeling analysis. A few simple statistical assumptions form the basis of these analyses:
1. There are always some differences between minority and majority groups in some way. The observation of large group differences is typically a necessary but not sufficient condition for test bias.
2. Test bias is reflected in some form of conditional group difference. We ask a question such as: For two different individuals in different groups, assuming all else is equal, how large are the differences between their observed scores?
3. A mathematical model can be used to quantify the form, direction, and magnitude of these conditional differences. In most models, test bias refers to group differences that remain after other critical predictors are taken into account.
4. A statistical model can be used to evaluate the accuracy, precision, or confidence of these quantities. These results can be used to rule out spurious effects due to sample size or sample bias, and allow direct and appropriate comparisons among different research studies.
These kind of assumptions are not novel, but they can have considerable impact in a data analysis approach to understanding test bias issues. For example, we do not try to answer common questions such as: Is test X biased against group B? This is the kind of “yes or no” question that cannot be dealt with without a variety of ambiguous assumptions about design and inference (e.g., see Cohen, 1994). Instead, we ask: How much, and in what way, is test X biased against group B, and how certain are we about these results? This explicitly means that all tests are biased in some way and the data analysis should be designed to examine the form, direction, magnitude, and accuracy of these biases. This approach allows tests to be “biased” against the larger (majority) groups, although this is unlikely in practice. More critically, this approach allows us to move away from simple yes or no opinions and toward answers for some difficult scientific questions.
Sample Data on Academic and Athletics
Since 1984, the National Collegiate Athletic Association (NCAA) Research Committee has been collecting survey information on the academic performances of large samples (N > 12,000) of college student-athletes (SA). The NCAA Academic Performance Study (APS) data include information on academic performances in high school, such as grades and ACT–SAT test scores; in college, such as grades and matriculation status, and also information about the college, such as average class SAT–ACT and graduation rates. Data from the first 2 years of this study (1984–1985 longitudinal records) were selected for analysis for two reasons—these high-school seniors were admitted to college before the new initial eligibility rules were put into effect, and a 5-year college record is now available. A statistical summary of the available data from the first two years of this study is presented in Table 8.1 (also see McArdle & Hamagami, 1994; NCAA, 1991a, 1991b, 1991c).
These data include approximately 4,500 SA who entered 81 different Division I colleges in 1984 and 1985. For the purposes of the analyses to follow, we eliminated records: (a) having implausible data (2%), (b) with incomplete longitudinal data (23%), (c) non-U.S. citizens (4%), or (d) with missing data on key variables (5%). We also used only records where the race/ethnicity question was answered as either “White Non-Hispanic” or “Black,” and this eliminated a small percentage of students (3%) who were either Asian, Native American, or Alaskan Native, Asian or Pacific Islander, or Hispanic. A college graduate was defined here as a student-athlete who graduated from the institution he or she initially attended within five years. We eliminated information from a very small set of SA (< .5%) at 14 colleges where the graduation outcomes were identical for all SA (e.g., no SA within the school graduated). Using these selection criteria, we obtained complete information on 3,224 student-athletes from 68 different colleges.
These selections lead to the statistics for the 1984–1985 freshman student-athletes presented in Table 8.1. Data from the two cohorts are presented separately, and some sampling differences between 1984 and 1985 can be seen here. These cohort sampling differences turn out to be minor in comparison with other group differences. Overall, about 75% of these SA were reported by the college as being White (Caucasian, Non-Hispanic), whereas about 25% were reported by the college as being Black. The overall graduation rates were obtained 5 years later (in 1990 and 1991). On average, the graduation rates are about 50% overall, above 50% for White SA, and closer to 30% for Black SA. Confidence boundaries for these rates are very small, so these group differences are relatively large. This disparity in the graduation rates for White and Black students is not unusual, and matches other national statistics (e.g., Porter, 1990).
Reasons for these group differences in graduation rates are not clear. One possibility raised by previous research is that the White and Black student groups differ in their precollege academic skills. In Table 8.1, the average Core-GPA for all SA is about 2.9 (on the usual 4-point scale), but this average GPA is closer to 3.0 for White SA and about 2.5 for Black SA. In this same table, the average SAT or ACT scores for all SA is about 870 (on the 1984 SAT 400–1200 scale), but this average is closer to 940 for White SA and about 670 for Black SA. These observed group differences are more than one standard deviation (s.d.) unit in size, but these results are not atypical (see Klitgaard, 1985; Porter, 1990).
TABLE 8.1
A Statistical Summary of the Student-Athlete Data for 1984–1985 Freshman From the NCAA Academic Performance Study (APS)
A Statistical Summary of the Student-Athlete Data for 1984–1985 Freshman From the NCAA Academic Performance Study (APS)
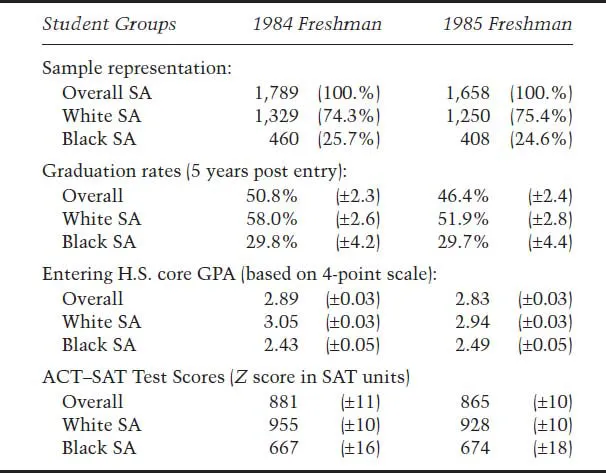
Notes: Data extracted from various 1991 NCAA Reports.
Percentages are followed by the approximate 95% margin of error.
Ethnicity determined by questionnaire response of school administrator.
Mean Core GPA and ACT–SAT are followed by 95% confidence interval.
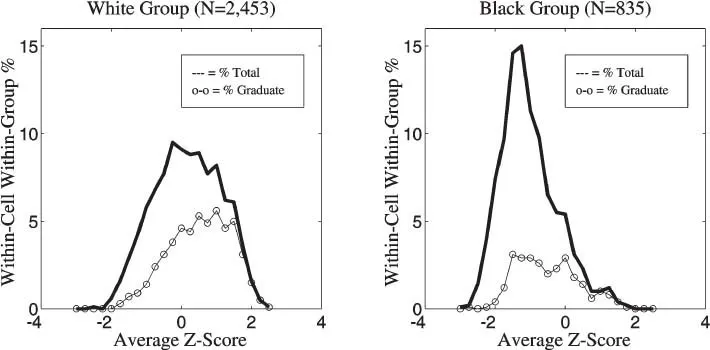
FIG. 8.1. Summary distributions of average Z-scores (GPA and test composite) for White and Black student-athlete groups. Notes: These numerical values are identical to those listed in Table 8.1.
Average Z is formed as a simple average of two precollege variables—the CGPA Z-score and the test Z-score (either SAT or ACT in a Z-score form).
Percentage total is the percentage at or below the current Z-value, based on either N = 2,453 (White) or N = 835 (Black) enrolled SA. Percentage graduate is a percentage at or below the current Z-value based on N = 1,282 (White) or N = 222 (Black) graduated SAs.
As a simple summary of more information about high school academic skills, we calculated additional variables: ZTEST indicates a standardized Z-score for SAT, ACT, or both; ZCGPA indicates a Z-score for high school grades in 11 “core” courses; Average is an equally weighted combination of the Z-score forms of both variables. Fig. 8.1 shows the frequency distribution of these average Z-scores separately for the White (75%) and Black (25%) groups. Once again, large differences in these distributions are seen between the White and Black students. The White SA have a symmetric distribution centered around Z = 0, whereas the Black SA have a skewed distribution centered just below Z = −1. In both groups, the distribution of the SA who graduated shows generally higher average Z scores (for details, see McArdle & Hamagami, 1994).
Evaluating Policy on Academics and Athletics
The substantive basis of this research is based on a contemporary issue in college athletics—the NCAA initial eligibility rule colloquially known as “Prop 48.” This rule w...
Table of contents
- Cover
- Half Title
- Title Page
- Copyright Page
- Dedication
- Table of Contents
- Introduction
- I. Keynote Speakers
- II. Invited Talks
- III. Poster Session Papers
- IV. Discussions
- HCA Conference Participants
Frequently asked questions
Yes, you can cancel anytime from the Subscription tab in your account settings on the Perlego website. Your subscription will stay active until the end of your current billing period. Learn how to cancel your subscription
No, books cannot be downloaded as external files, such as PDFs, for use outside of Perlego. However, you can download books within the Perlego app for offline reading on mobile or tablet. Learn how to download books offline
Perlego offers two plans: Essential and Complete
- Essential is ideal for learners and professionals who enjoy exploring a wide range of subjects. Access the Essential Library with 800,000+ trusted titles and best-sellers across business, personal growth, and the humanities. Includes unlimited reading time and Standard Read Aloud voice.
- Complete: Perfect for advanced learners and researchers needing full, unrestricted access. Unlock 1.5M+ books across hundreds of subjects, including academic and specialized titles. The Complete Plan also includes advanced features like Premium Read Aloud and Research Assistant.
We are an online textbook subscription service, where you can get access to an entire online library for less than the price of a single book per month. With over 1.5 million books across 990+ topics, we’ve got you covered! Learn about our mission
Look out for the read-aloud symbol on your next book to see if you can listen to it. The read-aloud tool reads text aloud for you, highlighting the text as it is being read. You can pause it, speed it up and slow it down. Learn more about Read Aloud
Yes! You can use the Perlego app on both iOS and Android devices to read anytime, anywhere — even offline. Perfect for commutes or when you’re on the go.
Please note we cannot support devices running on iOS 13 and Android 7 or earlier. Learn more about using the app
Please note we cannot support devices running on iOS 13 and Android 7 or earlier. Learn more about using the app
Yes, you can access Human Cognitive Abilities in Theory and Practice by John J. McArdle, Richard W. Woodcock, John J. McArdle,Richard W. Woodcock in PDF and/or ePUB format, as well as other popular books in Psychology & Mental Health in Psychology. We have over 1.5 million books available in our catalogue for you to explore.