![]()
by SIR ERNEST RUTHERFORD, P.R.S., F. A. B. WARD, B.A. Goldsmiths’ Senior Student, and C. E. WYNN-WILLIAMS, PH. D., Exhibition of 1851 Senior Student
From The Proceedings of the Royal Society, A, 129, 1930, pp. 211–34
Introduction
IN a recent paper,* Ward, Wynn-Williams, and Cave have described a method of counting accurately the number of α-particles emitted per second from a radioactive source. This method—the practicability of which was first shown by Greinacher†—involves the amplification by means of thermionic valves of the small ionisation current caused by an α-particle in a few millimetres of its path in air. The amplification can be made linear, so that the final current which actuates the recording instrument is proportional to the ionisation produced by the particle in the ionisation chamber. Compared with that produced by an α-particle, the ionisation produced by a β-particle is too small to be recorded under working conditions. In their work on the determination of the number of α-particles emitted per second from a gram of radium, the magnified current was passed through an Einthoven galvanometer, and clear photographic records were obtained when the α-particles were entering the chamber at a rate of several hundred a minute. Under the conditions of the experiment, the β and γ-radiations were too weak to cause any disturbance, thus enabling the determination to be carried out with accuracy.
For many purposes, however, it is essential to count particles in the presence of strong γ-radiation, and to achieve this end special attention had to be paid to the amplifying and recording system. An account will be given in a later paper by Wynn-Williams and Ward, of the arrangements employed for this purpose, but it suffices to say here that the ions produced by a particle in the detecting vessel should be driven on to the collecting electrode in a time of the order of 10−3 sec., and that the process of amplifying and recording should be sufficiently rapid to give a trace in an interval of less than 10−3 seconds. For this purpose, a special oscillograph was constructed which has been found to be very effective. With these modifications it has been found possible to count α-particles at the rate of several hundred per minute even in the presence of strong γ-radiation.*
Geiger and Klemperer† have succeeded in modifying the original Geiger point counter so that it, too, is linear, and gives a measure of the ionisation due to a single particle. For some kinds of experiment, this type of counter has definite advantages over the Greinacher type, inasmuch as the ionisation current is magnified several hundred times by collision. The purpose of this paper is to give examples of the utility of the Greinacher method in counting α-particles under different conditions, and to describe a new method for analysing in detail the complexity of the α-rays expelled from certain radioactive bodies.
It will be seen that we have been able in this way to detect the presence of the long-sought-for group of α-particles of short range emitted in the dual disintegration of radium C, although they are present in only about 1 part in 3,000, mixed with the main group of α-particles of range 7 cm. It will also be shown by this method that the α-rays from actinium C are more complex than was previously supposed.
Experimental Method
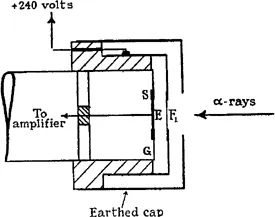
Fig. 1 shows the design of the ionisation chamber. The front of the chamber, F1, was formed by sheet of mica, of stopping power about 1·2 cm. for α-rays, which was thinly sputtered with silver, or covered with thin gold foil; 2 mm. behind this was the collecting electrode E, which was supported from the earthed guard-ring, G, by a ring of sealing-wax or sulphur, S. The sputtered mica was maintained at a potential of + 240 volts, so that a uniform field of about 1,000 volts/cm. was maintained throughout the chamber. When an α-particle enters the chamber, the ions from 2 mm. of its path are driven by this field on to the collecting electrode. This electrode is connected directly to the free grid of the first valve of the amplifier. The entry of an α-particle into the chamber accordingly raises the potential of this grid by about 10−4 volt, and the charge on the grid then leaks away in a time of the order of 10−3—10−2 seconds, depending on the capacity and leak resistance of the insulated grid system. To obtain the maximum peak voltage for a single particle, the capacity should be as small as possible; hence for the first valve a Marconi V24 or DEV was used, as in these two types the grid lead is brought out to a separate cap. In general, the rest of the amplifier followed normal wireless practice. Extremely careful screening had, however, to be employed, and other points of technical interest had to be attended to; these will be dealt with in a separate paper to be published shortly. Recording was carried out photographically by means of a moving-iron oscillograph of special design, which will also be described later. The whole amplifying and recording system was linear in characteristic, so that the final deflection of the oscillograph spot was a true measure of the ionisation produced by the particle in the chamber. This linearity is a great advantage, since it means that each deflection recorded is not merely a unit, but an ionisation measurement.
Fig. 1
Single chamber counter.
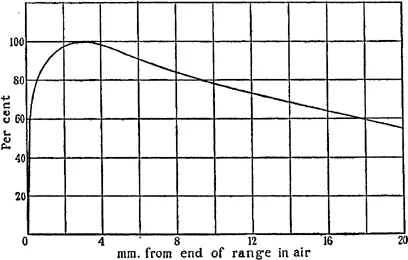
Feather and Nimmo* have investigated the variation of ionisation along the track of an α-particle in air; their method was to photograph the tracks formed by the particles in a Wilson chamber, and to measure the photographic density along the records of the tracks. Their curve is given in fig. 2. It is seen that an ambiguity arises in determining the residual range of an α-particle from the magnitude of the ‘kick’ recorded by the counter, since there are in general two different ranges giving the same ionisation. This difficulty in interpretation is only serious when a very complex α-radiation is being examined, and it is completely eliminated by the differential method of analysis described later.
As so much of the present work depends upon the linear ratio which exists between the charge given to the first grid, and the deflection of the recording instrument, this relation was investigated very carefully by a series of experiments (to be described in a later paper), and found to hold over the whole of the working range of deflections. A simple experiment, however, illustrates the fact that the deflections of the oscillograph are really ionisation measurements. A very weak source of thorium (B + C) on a brass plate was brought up in steps towards the ionisation chamber. Photographs were taken at each step, and the average size of the deflections at each point was measured. When this average size was plotted against the distance from source to chamber, the familiar Bragg ionisation curve was obtained. A photograph (fig. 16, Plate 2) is reproduced from a portion of the record obtained when the source was 4 cm. from the chamber. It will be seen that two different sets of kicks are present, the larger ones due to the particles of 4.8 cm. range, which have the peaks of their ionisation curves in the chamber, and the smaller ones due to the 8·6 cm. particles, which are on the lower portion of their ionisation curves. Experiments similar to these have been described by Ortner and Stetter,* who also worked with the Greinacher type of linear counter, and further work has been done by Schmidt and Stetter, † who paid particular attention to its use in experiments with H-particles.
Fig. 2
Ionisation curve of single α-particle.
Experiments have been made with this apparatus to study the long-range α-particles emitted from radium C and thorium C, and a detailed account of these will be published later. Some of the results for thorium C are given here as a further illustration of the usefulness of this method of counting. The general form of the absorption curve showing the number of these particles exceeding a given range is given in fig. 3. The curve shows two groups of particles of mean range 11·5 cm. and 9·8 cm. respectively, in good general agreement with the results of Nimmo and Feather, ‡ and of Meitner and Freitag§ obtained with the aid of a Wilson chamber. Reproductions of the photographs obtained at four different points of the curve are given in figs. 15 (a), (b), (c), (d), Plate 1. The first, fig. 15 (a), corresponding to (a) on the graph (fig. 3), shows kicks of all sizes. This, of course, is a result of the straggling of the α-particles in their passage through matter. Even if expelled with identical velocities, the α-particles travel different distances in the gas, the ranges being distributed in a Gaussian manner about the mean. At a point such as (a) on the curve of fig. 3, some of the particles have not reached the chamber at all, others stop in the middle of it, and others pass right across it, so that a great variety of sizes of kick is to be expected. At (b) all the particles pass right across the chamber, and most of them are on the peaks of their ionisation curves. The second record, fig. 15 (b), was obtained at this point and shows the kicks mainly large but still a little variable in size, as expected. The third record, fig. 15 (c), taken ...