![]()
1 U.S. Energy Production and Consumption
An Overview
Don E. Albrecht
Historically, the primary sources of energy for agriculture, transportation, industry and other human endeavors were efforts of humans and their domesticated animals. Wood and other forms of biomass were the major sources of heat for cooking and home heating. Limitations imposed by these energy forms suppressed productivity and living standards. Transportation was slow, work was tedious and productivity minimal.
Much changed with the start of the Industrial Revolution. In the main, the Industrial Revolution was simply a result of the growing capacity of humans to harness and utilize fossil fuels as an energy source. Fossil fuels were formed from organisms that lived long ago and over time were transformed into coal, oil, natural gas or other products that burn easily and release energy as they do so. The increased capacity of humans to use fossil fuels as an energy source has completely transformed the way of life for millions of people and has resulted in rapid economic growth. Fossil fuels power cars, trucks, trains and planes, and they have dramatically increased transportation speed and capacity. Fossil fuels are used to operate farm equipment and factories, and they have greatly increased the work capacity of individuals. Fossil fuels heat and cool our homes and provide electricity to keep the lights on and to operate our televisions, radios and computers with the flip of a switch. Additionally, fossil fuels are used extensively in plastics, fertilizer, pesticides and many other products of our modern world.
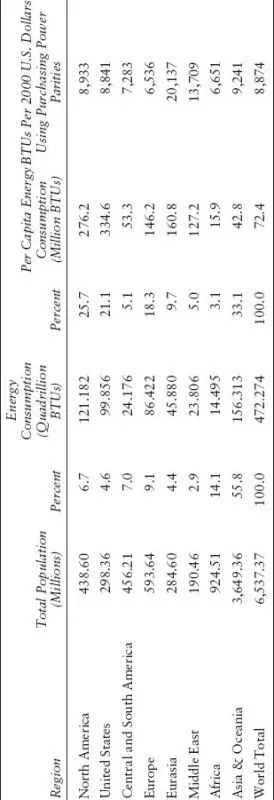
Table 1.1 provides data on international energy consumption. This table shows that while the U.S. had only 4.6 percent of the world’s population in 2006, Americans consumed 21.1 percent of the energy. Per capita energy consumption in the United States is far greater than in other places around the world. The average American consumes twenty-one times more energy than the average person from either Africa or India, six times more than the average Chinese, and twice as much as the average European where incomes in many countries are as high or higher than in the United States. Energy consumption is strongly related to Gross Domestic Product. Generally, countries that consume the most energy have the highest GDPs. However, Table 1.1 shows that Europeans are more efficient than the U.S. in that they produce more with less energy.
Table 1.1 International Energy Consumption in 2006
Source: Energy Information Administration, U.S. Department of Energy.
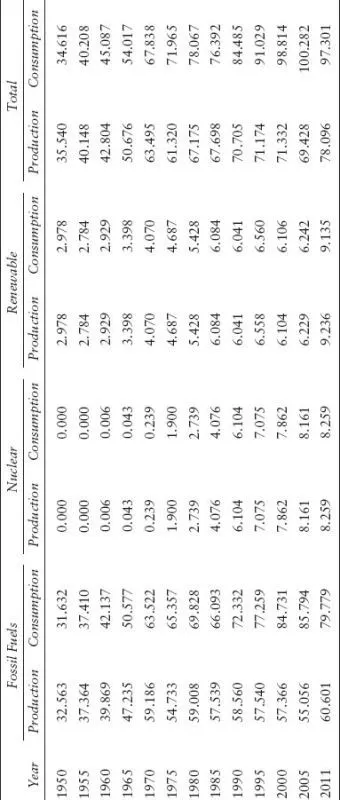
Table 1.2 Energy Production and Consumption by Source in the United States, 1950–2011 (Quadrillion BTU)
Source: Energy Information Administration, U.S. Department of Energy.
Table 1.2 provides data on energy production and consumption in the United States from 1950 to 2011. Most significantly, this table shows that energy consumption increased greatly during this time period. In 2011 Americans were consuming about three times more energy than in 1950. Of course, some of this increase is a consequence of population growth. The extreme dependence of the United States on fossil fuels is also apparent. In 2011, 82.1 percent of energy consumed in the United States was from fossil fuels, with only 8.5 percent from nuclear power and 9.4 percent from renewable energy sources.
While the benefits of fossil fuel development are extensive, nevertheless there are major concerns associated with our continued heavy reliance on fossil fuels. Included among the issues associated with fossil fuel dependence are: (1) the inevitable depletion of finite fossil fuel resources; (2) problems resulting from reliance on foreign energy supplies; (3) environmental problems associated with fossil fuel extraction and transportation; (4) emission of climate-changing greenhouse gasses; and (5) socioeconomic and community implications. Because of these concerns, our dependence on fossil fuel must be reduced (Geri and McNabb 2011; Lester and Hart 2012; Sioshansi 2011). This chapter begins with an overview of fossil fuel production and consumption. A discussion is then provided of the relationship between fossil fuels and the five issues mentioned above. The chapter concludes with a discussion of the options available for a transition away from fossil fuel dependence. For several of the most significant or recently emerging issues, more detail is provided in later chapters of this book.
Fossil Fuel Production and Consumption
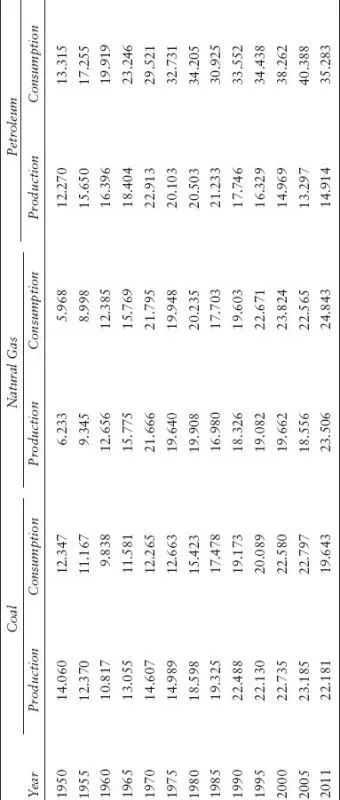
Table 1.3 provides a more detailed examination of fossil fuel production and consumption in the United States from 1950 to 2011. Coal (24.6 percent) and natural gas (31.1 percent) provided more than one half of the energy from fossil fuels consumed in the U.S. in 2011. However, almost half (44.3 percent) of the fossil fuel energy consumed in the U.S. in 2011 was from petroleum. The U.S. has extensive coal and natural gas reserves, and it is evident from Table 1.3 that current production of these resources is sufficient to meet present demand. On the other hand, petroleum production falls far short of consumption, requiring substantial imports.
Petroleum
Petroleum is the single most important energy source in the world today. Transportation is the most prominent user of petroleum products, most of which are derived from crude oil. In the U.S., the transportation sector uses about 71 percent of the petroleum consumed to fuel approximately 250 million vehicles. To put U.S. petroleum consumption into perspective, according to the Energy Information Administration, about 378 million gallons of gasoline are consumed each day – and this is not counting diesel, jet fuel, home heating oil, or petroleum used in the production of asphalt, plastics and other products.
Table 1.3 Fossil Fuel Production and Consumption by Type in the United States, 1950–2011 (Quadrillion BTU)
Source: Energy Information Administration, U.S. Department of Energy.
Among the major problems associated with crude oil in the U.S. are inadequate supplies and the consequent depletion of existing resources. As of 2011, less than 10 percent of global crude oil production comes from the United States. U.S. crude oil production reached a peak in 1970 and then declined rapidly until a recent resurgence (Table 1.3). Until about 2008, declining production was rather pronounced. By 2005, after years of declining production and growing consumption, only 32.9 percent of the petroleum consumed in the United States was produced there.
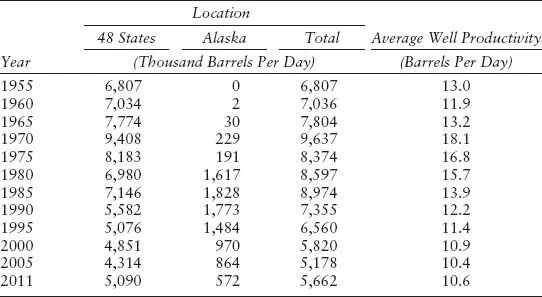
Table 1.4 makes the reasons for declining U.S. oil production even more apparent. This table shows that the overall U.S. oil production increased until 1970. This increase was associated with the discovery of new oil fields and improved technology that allowed average well production to increase steadily until it reached a high of 18.1 barrels per well per day. Since that time, per well production has declined significantly as oil resources have become depleted and wells in less productive locations have been brought on line. By 2008, per well production was averaging only 9.4 barrels per day. Again, there have been increases in recent years.
The severity of the decline in U.S. oil production was initially offset by increased production from Alaska. In the 1960s, what proved to be the largest oil field in North America was discovered at Prudhoe Bay on the North Slope of Alaska. This oil field originally contained an estimated twenty-five billion barrels of oil. In 1975 construction began on an eight-hundred-mile pipeline to transport oil from Prudhoe Bay to Valdez, Alaska, the northernmost ice-free port in North America. The pipeline cost an estimated $8 billion to build and opened in 1977. Since that time over fifteen billion barrels of oil have been successfully transported. With the pipeline in place Alaskan oil production reached a peak in 1985, but it has since declined sharply with the depletion of the Prudhoe Bay oil fields.
Table 1.4 Crude Oil Production by Location and Average Productivity per Well in the United States, 1955–2011
Source: Energy Information Administration, U.S. Department of Energy.
In recent years U.S. oil production has been enhanced by the development of new technologies. Horizontal drilling and hydraulic fracturing (fracking) have made it economically feasible to produce “light tight” oil from shale formations. This same technology has also dramatically impacted natural gas production (which will be discussed later). Utilization of these “unconventional” strategies has allowed development to occur in the Bakken and other shale formations. The Bakken Field is centered in North Dakota, extending into Montana as well as Saskatchewan and Winnipeg in Canada. As a consequence of the advent of fracking, North Dakota oil production increased from 29 million barrels in 2003 to 153 million barrels in 2012. As a consequence of recent production increases and consumption declines, by 2011 the U.S. was able to produce 42.3 percent of the petroleum it consumed. The Energy Information Administration projects that fracking will greatly increase U.S. energy production and thus reduce the need for energy imports. In fact, the International Energy Agency has forecast that the U.S. will become the world’s biggest oil producer by 2020, and a decade later it will become energy independent.
Coal
Known coal deposits in the U.S. contain more energy than all the world’s known oil reserves combined. Not only is coal relatively plentiful, it is also cheap to produce. Coal accounted for nearly one half of the increase in global energy use over the past decade, largely because of increased coal development in China (International Energy Agency 2011). Currently coal is used to generate about half of the electricity consumed in the U.S. While U.S. coal supplies are relatively plentiful, two factors will inhibit coal use in the future. First, coal produces more pollution and climate-changing greenhouse gasses per unit of energy generated than other energy alternatives (e.g. Jaramillo et al. 2009). For example, coal produces more than twice as much carbon dioxide per unit of electricity generated than natural gas. Second, given current technology, coal cannot be used efficiently in the transportation sector. As a consequence of these disadvantages, coal production and consumption has declined slightly in recent years. Given climate change concerns, it is very likely that the key innovation for coal use in the future will be the development of carbon capture and storage or other “clean coal” technologies that will allow coal to be used in a cost-effective manner while also protecting the environment.
Table 1.5 presents data showing coal production in the United States from 1950 to 2011. This table indicates that coal production has increased substantially since 1960. Much of this increased coal production came following the OPEC embargo of the 1970s. This embargo revealed the extent of dependence of the U.S. on foreign energy sources, and thus made our vulnerability evident. The result was significant efforts to increase domestic production to help achieve energy independence.
Table 1.5 also shows that down the years there have been major changes in mining methods and the location of coal production in this country. In 1950, 75 percent of coal produced in the United States was from underground mines, and most (93.6 percent) was taken from mines east of the Mississippi. The most significant coal mining areas in the middle of the last century were in the Appalachian regions of West Virginia, eastern Kentucky and western Pennsylvania. In the decades since, sub...