![]()
AN AGGREGATE PRODUCTION FUNCTION FOR JORDAN1
Khalil Hammad
INTRODUCTION
The purpose of the present chapter is to estimate a preliminary production function for the Jordanian economy. Although many econometric models have been formulated and estimated for the country’s economy, none of them has included an aggregate production function. This is due to the fact that Jordan has no statistics on capital stock. In this chapter, time series capital stock is generated for the period 1967–81 and used as an input or factor of production. It is assumed that output is a function of capital stock and labour. Output or GDP and labour services are taken from Jordanian original sources in current values and then deflated by the implicit GDP deflator.
The Cobb-Douglas production function is widely used in economic analysis and it is used in this study. The function is estimated in log-linear form by the ordinary least squares method. The statistical results will indicate what returns to scale are prevailing in Jordan. In addition, output elasticity with respect to each input, namely, capital and labour, will be examined.
GENERATING CAPITAL STOCK
A time series capital stock for Jordan was generated by the author for the period 1967–79; the series was used to construct a profit index which served as an explanatory variable in an investment demand function.2 In this chapter, two time series capital stock will be generated for the period 1967–81. The methodology follows that of Adelman and Chenery in their study of the Greek development experiences.3
The first step to generate capital stock is to calculate the overall incremental capital-output ratio (ICOR) for the period under study. Capital stock figure for the first year of the study period is obtained by multiplying overall ICOR by the GDP for that year. Subsequent figures of capital stock are derived by cumulating net capital formation.4
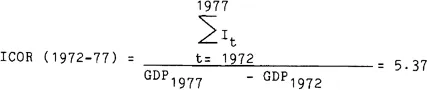
In calculating the incremental capital-output ratio for the aggregate economy of Jordan for the period 1972–79, the Japan International Co-operation Agency (JICA) used the formula:5
Where:
It= Net capital formation in the year t;
GDP1972 GDP1977 = Gross domestic product in the years 1972, 1977 respectively.
Using the ICOR formula for four sub-periods of 1972–77, the JICA calculated different ICORs, which ranged from 2.02 to 5.37. High ICORs, the JICA concluded, seem to be caused by high rates of increase in capital investment in recent years. The JICA assumed, therefore, that ICOR for the aggregate economy, as well as for the study area of northern Jordan, will be 3.0 for the future until 1985.6
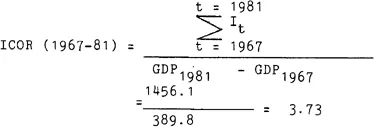
Using the JICA formula to calculate the overall ICOR for the period 1967–81 (data taken from Table 1.1) it is found that ICOR is 3.73.
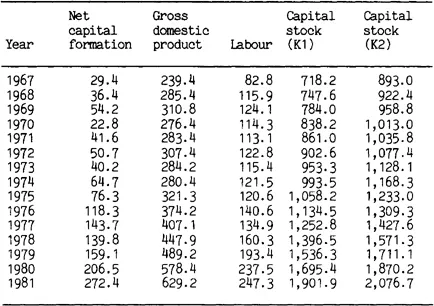
Table 1.1: Capital Stock Generated, Labour, Gross Domestic Product and Net Capital Formation, 1967–1981 (million constant Jordanian dinars, 1975 = 100)
Sources: net capital stock, GDPs and labour are taken from: Central Bank of Jordan, Monthly Statistical Bulletin (Amman), vol. 19, no. 10 (Oct. 1983), tables 42, 43; Jordan, Dept of Statistics, National Accounts in Jordan 1967–1977 (Amman, 1967), pp. 14–60, and National Accounts in Jordan 1978–1982 (Amman, 1978), pp. 25–44.
It was estimated by the National Planning Council (NPC) that ICORs were 1.9:1 and 2.61:1 for the two periods 1948–61 and 1962–66 respectively.7 A UN study (1970) estimated ICOR for the 1954–64 period and projected future ICOR as 3.00.8
For generating capital stock along the lines of Adelman and Chenery, however, we make two assumptions concerning ICOR: (1) we assume, with both UN and JICA studies on Jordan, that this ICOR = 3.0; (2) we assume that ICOR = 3.73, the actual one calculated in this study.
With ICOR = 3.0, capital stock for the year 1967 equals three times the GDP in 1967. Subsequent figures of capital stock for the years 1968–81 were derived by cumulating net capital formation. We call this series of capital stock K1.
With ICOR = 3.73, capital stock for the year 1967 equals 3.73 times the GDP in 1967. Similarly, subsequent figures of capital stock for the years 1968–81 were derived by cumulating net capital formation. We call this series of capital stock K2.
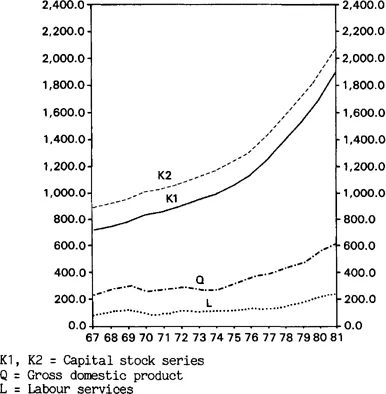
The two series of capital stock, labour services, net capital formation and GDP are given in Table 1.1 in millions of constant JDs. These variables are plotted in Figure 1.1.
Figure 1.1: Capital Stock, Labour Services and Gross Domestic Product, 1967–81
AGGREGATE PRODUCTION FUNCTION
A production function denotes the maximum output that can be obtained from a set of inputs. It is a function in the mathematical sense because it is assumed that to each set of inputs there is a unique maximum output. Hence, a production function is a mapping from the input space, X, into the output space, Q.9
A commonly used production function in economic analysis, chosen for its mathematical properties and the possibility of being empirically estimated, is the Cobb-Douglas production function, which for the two-input case takes the form:
Where Q is output;
X1, X2 are the two inputs;
or more generally...