eBook - ePub
World Economic Outlook, October 2012 : Coping with High Debt and Sluggish Growth
- English
- ePUB (mobile friendly)
- Available on iOS & Android
eBook - ePub
World Economic Outlook, October 2012 : Coping with High Debt and Sluggish Growth
About this book
NONE
Tools to learn more effectively

Saving Books

Keyword Search

Annotating Text

Listen to it instead
Information
Publisher
INTERNATIONAL MONETARY FUNDYear
2012eBook ISBN
9781616353896Chapter 1 Global Prospects and Policies
Special Feature: Commodity Market Review
The first section of this special feature discusses developments in commodity prices, and the second confirms that fluctuations in demand have played a key role in the drop in prices during the second quarter of 2012. The important complementary role of supply developments is discussed for energy markets in the third section and for food markets in the fourth, as these contributed to sharp price increases during the third quarter of 2012. The special feature concludes with the outlook for commodity markets.
Price Developments during 2012
Broad developments
After a robust recovery during 2009–10, the IMF’s Primary Commodities Price Index (PCPI) stayed essentially flat during 2011 and then fell during the second quarter of 2012, only to stage a comeback in the third quarter (Figure 1.SF.1). The PCPI is a weighted average of prices for 51 primary commodities, grouped into three main clusters—energy, industrial inputs (mainly base metals), and edibles (of which food is the main component—Table 1.SF.1). Among the three clusters, energy and base metal prices declined during the second quarter by nearly 30 and 20 percent, respectively, from their first quarter peaks. Although metal prices have leveled off during the third quarter, energy prices increased sharply once again, by about 13 percent (through August). Food prices remained broadly flat until mid-June, but have increased since then, by about 10 percent.
Figure 1.SF.1. IMF Commodity Price Index
(2005 = 100)
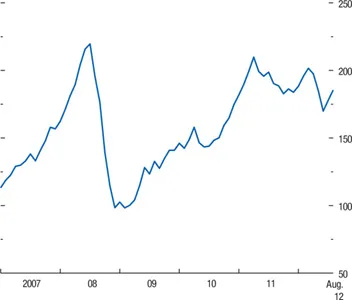
Source: IMF, Primary Commodity Price System.
Table 1.SF.1. Indices of Market Prices for Nonfuel and Fuel Commodities, 2009–12
(2005 = 100, in U.S. dollar terms)1
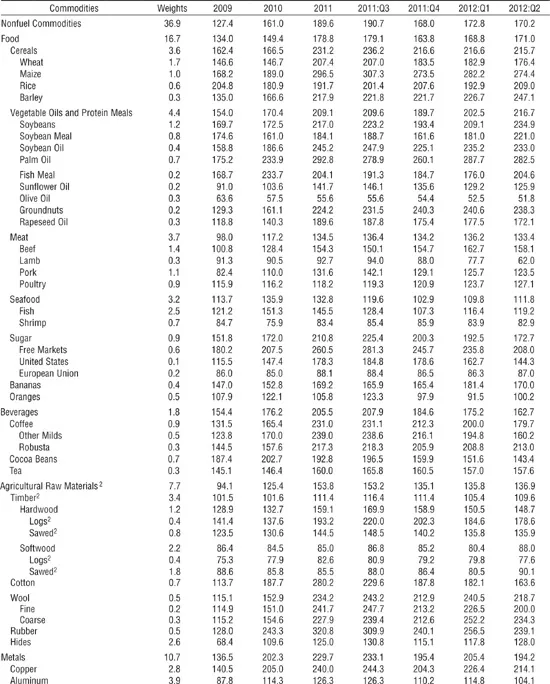
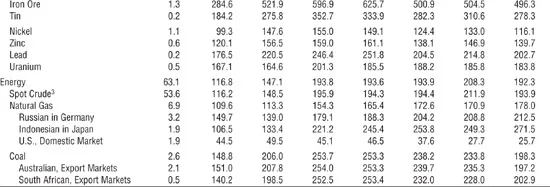
Source: IMF, Primary Commodity Price System.
1 Weights are based on 2002–04 average world export earnings.
2 Provisional.
3 Average petroleum spot price. Average of U.K. Brent, Dubai Fateh, and West Texas Intermediate, equally weighted.
Energy prices
The prices of petroleum, natural gas, and coal together have a weight of nearly two-thirds in the PCPI; petroleum alone accounts for more than half of the index. The average petroleum spot price (APSP)—a simple average of the Brent, Dubai, and West Texas Intermediate (WTI) crude oil varieties—increased from a low of $35 a barrel in late 2008 to a high of $120 a barrel in March 2012. Since then, oil prices declined during the second quarter only to climb back during the third, albeit with some volatility. Implied volatility remained moderate when compared with the spikes after the Libyan revolution in 2011 but picked up during the summer months (Figure 1.SF.2).
Figure 1.SF.2. Oil Prices and Volatility
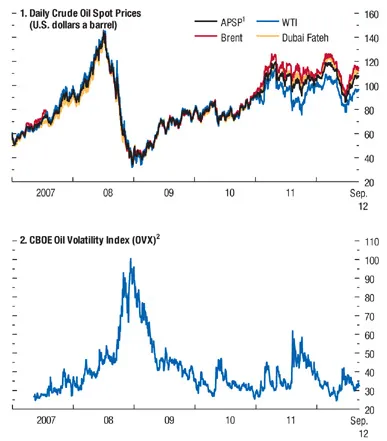
Sources: Bloomberg, L.P.; and IMF staff calculations.
Note: As of September 11, 2012.
1 Average petroleum spot price (APSP) is a simple average of Brent, Dubai Fateh, and West Texas Intermediate (WTI) spot prices.
2 CBOE = Chicago Board Options Exchange.
Metal and food prices
These two components comprise the remaining third of the PCPI, each receiving a similar weight. After a strong rally earlier in 2012, base metal prices declined in tandem with petroleum prices—albeit less sharply—during the second quarter and have leveled off somewhat during the third quarter (Figure 1.SF.3). After remaining broadly flat for much of the year, food prices started to pick up strongly in mid-June. Grain and soybean prices rose, offsetting the weakness in seafood, sugar, and vegetable oil prices. Implied volatility also rose significantly (Figure 1.SF.4).
Figure 1.SF.3. Base Metal Spot Prices
(Indices; January 1, 2007 = 100)
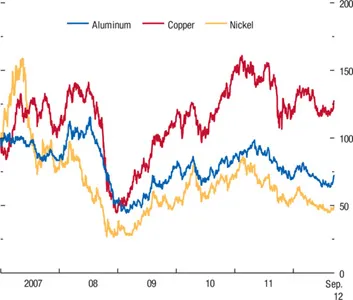
Sources: Bloomberg, L.P.; and IMF staff calculations.
Note: As of September 11, 2012.
Figure 1.SF.4. Food Prices and Volatility
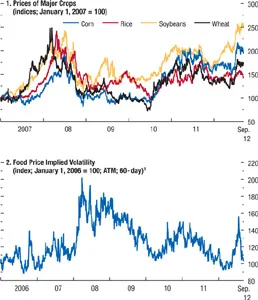
Sources: Bloomberg, L.P.; and IMF staff calculations.
Note: As of September 11, 2012.
1 ATM = at the money.
Economic Activity and Commodity Prices
A tight link with demand
Fluctuations in economic activity and in the outlook are the primary determinants of short-term commodity price movements, with some caveats. First, on occasion, causality goes the other way: supply disruptions can sometimes lead to price spikes and declines in economic activity (Hamilton, 2008). Second, developments on the supply side or concerns about supply depletion can be important enough to break the tight connection between economic activity and commodity prices even if they are not significant enough to derail economic activity (see Benes and others, 2012, for the case of oil prices). Third, concerns that speculative commodity trading has decoupled price movements from economic activity have been a constant refrain during the past few years despite the lack of conclusive supporting evidence.1
These caveats notwithstanding, a tight link between economic activity and commodity price fluctuations is evident in the data, and this appears to be the leading factor behind the broad commodity price declines during the second quarter. Commodity markets rallied somewhat in early 2012 on the back of recovering market confidence in response to the European Central Bank’s longer-term refinancing operations as well as better-than-expected global growth in the first quarter. However, with renewed setbacks to the global recovery in the beginning of the second quarter, leading indicators pointed to a synchronized slowing in the momentum of global activity. In particular, growth in a number of major emerging market economies, notably China, has slowed significantly. These common macroeconomic factors affect commodity prices through changes in current and prospective demand and the cost of carrying inventories.
Principal components analysis
The influence of common macroeconomic factors on commodity markets can be examined using principal component analysis, which extracts key factors that account for most of the variance in the observed variables. Individual commodity prices are affected by both commodity-wide and commodity-specific factors. The first principal component of commodity prices captures price movements driven by commodity-wide factors. The strong correlation between this first principal component and actual commodity prices across the board—more than 0.85 for all major commodity groups, including crude oil, food, and base metals—implies that individual commodity prices have been significantly affected by commodity-wide factors (Figure 1.SF.5, panel 1). Similarly, the first principal component from industrial production indices (IPs), purchasing managers’ indices (PMIs), and equity returns (using MSCI)—which are good proxies for global economic activity, economic sentiment, and broad asset market performance, respectively—capture the underlying common macroeconomic factors (Figure 1.SF.5, panel 2).
Figure 1.SF.5. Influence of Common Factors: Pairwise Correlations with First Principal Components
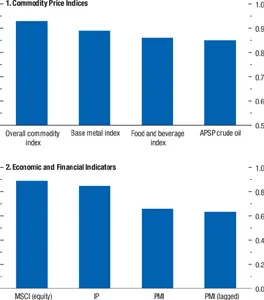
Source: IMF staff calculations.
Note: APSP = average petroleum spot price; IP = industrial production index; PMI = purchasing managers’ index.
The strong correlations between the first principal components for commodity prices and aggregate economic activity suggest that commodity-wide factors have mainly reflected common macroeconomic developments. Especially during the second quarter, the first principal component of commodity prices has shown a declining trend in line with the first principal component of IPs, PMIs, and equity returns, implying that the recent declines in commodity prices over this period were largely driven by global economic conditions (Figure 1.SF.6).
Figure 1.SF.6. Commodity Prices and Economic Activity: First Principal Components
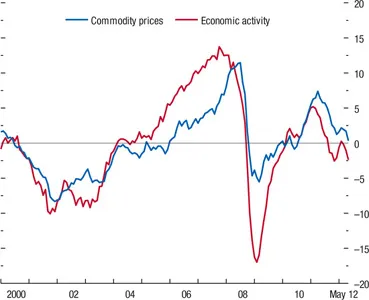
Source: IMF staff calculations.
Metal prices and Chinese activity
The link between prices and activity is also apparent for base metal prices. The slow recovery of advanced economies continued to exert a drag on base metal consumption, but it was the significant slowdown in major emerging market economies, notably China, that led to a sharp decline in global base metal consumption. In China, growth has been steadily moderating as the authorities have pursued policies aimed at slowing the economy to a more sustainable pace. Reflecting these policies, growth in industrial production fell to single digits after April for the first time since mid-2009, and real estate investment also slowed in recent months. China’s base metal consumption, which has been steadily increasing and now accounts for more than 40 percent of global consumption (Figure 1.SF.7, panel 1), slowed sharply in the second quarter. As a result, growth in global consumption of base metals slowed significantly in the second quarter (Figure 1.SF.7, panel 2). In line with this trend, base metal prices declined the most among major commodities, despite some supply response to lower prices.
Figure 1.SF.7. Demand for Base Metals
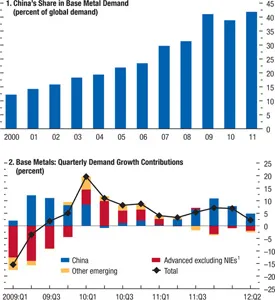
Sources: World Bureau of Metal Statistics; and IMF staff calculations.
Note: Weighted sum of aluminum, copper, lead, nickel, tin, and zinc.
1 NIEs = newly industrialized Asian economies.
Demand factors play a critical role by driving commodity-wide movements in prices, but the role of commodity-specific factors—which generally reflect specific developments on the supply side—is important as well. In petroleum markets, production decisions by producers, supply disruptions, and geopolitical concerns are often decisive in determining the course of prices, particularly when inventories are low. For food prices, weather is the predominant commodity-specific factor. The next two sections discuss the supply-demand balance in oil and food markets, respectively.
Supply-Demand Balance in Oil Markets
Supply surge
Oil supply expanded at an annual rate of 3.2 percent during ...
Table of contents
- Cover Page
- Title Page
- Copyright Page
- Contents
- Assumptions and Conventions
- Further Information and Data
- Preface
- Foreword
- Executive Summary
- Chapter 1. Global Prospects and Policies
- Chapter 2. Country and Regional Perspectives
- Chapter 3. The Good, the Bad, and the Ugly: 100 Years of Dealing with Public Debt Overhangs
- Chapter 4. Resilience in Emerging Market and Developing Economies: Will It Last?
- Annex: IMF Executive Board Discussion of the Outlook, September 2012
- Statistical Appendix
- World Economic Outlook, Selected Topics
- Tables
- Footnotes