NONE
eBook - ePub
How Emerging Europe Came Through the 2008/09 Crisis : An Account by the Staff of the IMF's European Department
- English
- ePUB (mobile friendly)
- Available on iOS & Android
eBook - ePub
How Emerging Europe Came Through the 2008/09 Crisis : An Account by the Staff of the IMF's European Department
About this book
Trusted by 375,005 students
Access to over 1.5 million titles for a fair monthly price.
Study more efficiently using our study tools.
Information
Publisher
INTERNATIONAL MONETARY FUNDeBook ISBN
9781616353810
Year
2012PART I. Prelude to the Crisis
CHAPTER 1. The Boom Years, 1995–2007
Since the onset of transition in the early 1990s, emerging Europe has seen impressive progress. In a span of less than 20 years, the region went from central planning to successful market economies (Åslund, 2007). Institutions were modernized, often in the context of an EU accession process. Foreign direct investment poured in to benefit from highly skilled labor available at low cost. Great strides were made toward trade and financial integration with western Europe.
This transition from a planned to a market economy boosted growth, and after an initial decline in output, emerging Europe grew faster than almost all other emerging market regions. Per capita income expanded by 4 percent annually from 1995 to 2007—exceeded only by China and India (Figure 1.1). Economic growth was further stimulated by the anticipation of rapid future income growth, declining real interest rates, and increasingly buoyant global economic and financial conditions. As a result, per capita GDP for the region rose from 28 percent of Germany’s GDP per capita in 1995 to 39 percent in 2007.
Figure 1.1 Emerging Europe and Selected Regions: Real Per Capita GDP Growth, 1995–2007
(Annual percentage change in purchasing power parity terms)
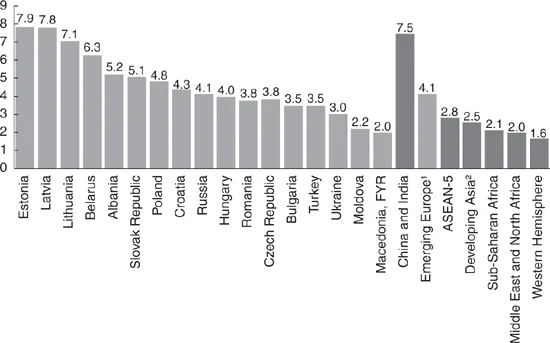
Source: IMF, World Economic Outlook database.
Note: ASEAN-5 = Five of the member countries of the Association of Southeast Asian Nations, including Indonesia, Malaysia, the Philippines, Thailand, and Vietnam.
1 Includes the Czech Republic and the Slovak Republic.
2 Excludes China and India.
Until 2003, growth was driven largely by exports, which grew rapidly as trade became integrated with the west. By 2007, the euro area had become the main trading partner of most countries in the region (Tables 1.1 and 1.2).1 Owing to their geographic proximity and relatively low labor costs, the central and eastern European (CEE) countries became part of an integrated cross-border production chain, with western European manufacturers shifting the production of components and intermediate goods to the east. German automakers were particularly active in outsourcing to CEE countries.2 During this decade, capital inflows remained moderate and went largely to the tradable sector.
Table 1.1 Emerging Europe: Exports of Goods, 1995–2007
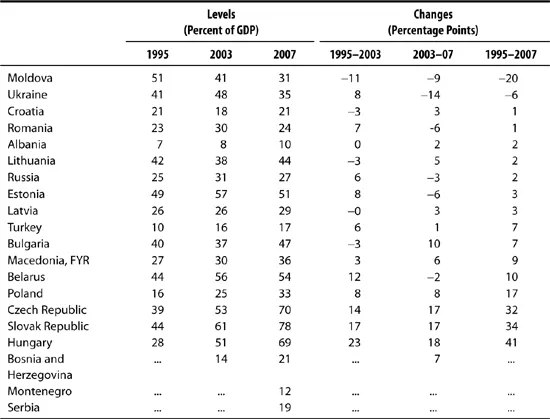
Sources: IMF, Direction of Trade Statistics and World Economic Outlook databases.
Table 1.2 Emerging Europe: Direction of Exports, 2007
(Percent of GDP)
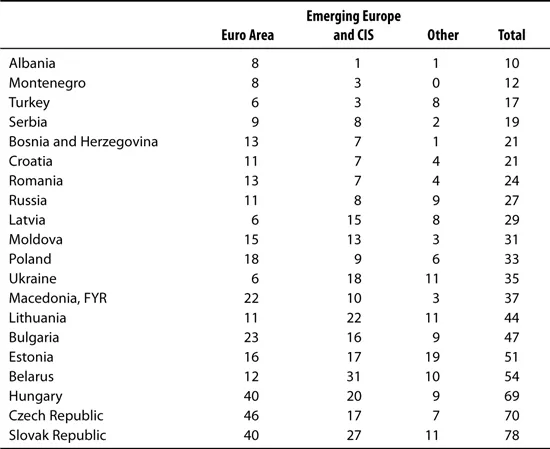
Sources: IMF, Direction of Trade Statistics database; and World Economic Outlook database.
Note: CIS = Commonwealth of Independent States.
From 2003 onward, however, growth in the region was increasingly driven by a domestic demand boom (Figure 1.2). During 2003–08, domestic demand growth in the region averaged 8¼ percent annually—well above GDP growth (6½ percent per year). The boom was most pronounced in the European CIS countries, the Baltics, Bulgaria, Montenegro, and Romania.3 In these countries domestic demand grew by 9–13 percent. In other countries domestic demand growth was more moderate at 4–6 percent per year (these countries included Albania, Bosnia and Herzegovina, Croatia, the Czech Republic, Macedonia, Poland, and the Slovak Republic). Domestic demand was weak only in Hungary, partly as a result of the substantial fiscal consolidation that took place in the precrisis years.
Figure 1.2 Emerging Europe: Domestic Demand Growth and GDP Growth, 2003–081
(Annual percentage change)
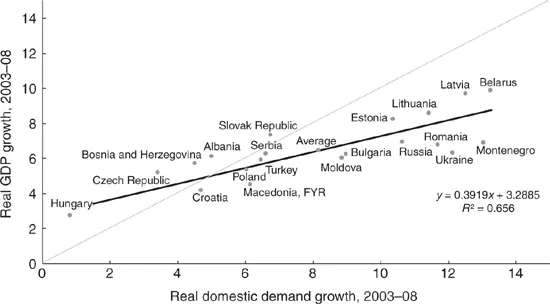
Sources: IMF, International Financial Statistics; and World Economic Outlook database.
1 As the boom in the Baltic states ended in 2007, data for the Baltics refer to 2002–07.
The Nature and Origins of the Credit Boom
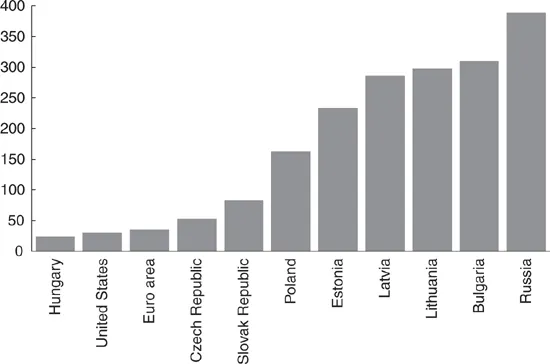
The demand boom was the result of a surge in bank credit and asset prices (Figures 1.3 and 1.4). Credit increased to both households and firms (Figure 1.5). Rapid credit growth was fueled by catch-up, since the countries that were poorer had generally faster credit growth. However, catch-up was only part of the story, as there were large differences in credit growth among countries with similar income levels. In some countries, the speed of credit growth exceeded what could be justified by appropriate financial deepening and jeopardized macroeconomic stability.4 By 2008, there were large differences in the credit-to-GDP ratios (Figure 1.6). Housing prices rose sharply and even equity markets surged, with an average annual increase of some 40 percent.
Figure 1.3 Emerging Europe: Domestic Demand and Private Sector Credit Growth, 2003–081
(Annual percentage change)
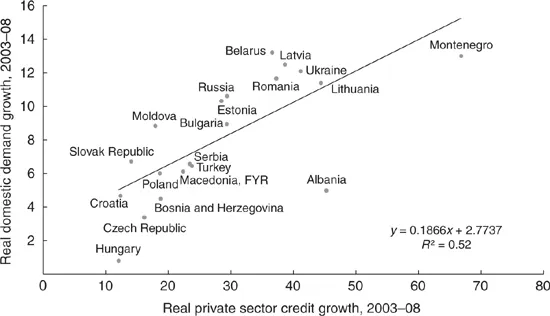
Sources: IMF, International Financial Statistics; and World Economic Outlook database.
1 As the boom in the Baltic states ended in 2007, data for the Baltics refer to 2002–07.
Figure 1.4 Emerging Europe: Change in Real Estate Prices, 2003–081
(Percent)
Sources: Bank for International Settlements, Property Price Statistics; Haver Analytics; and country statistical offices.
1 As the boom in the Baltic states ended in 2007, data for the Baltics refer to 2002–07.
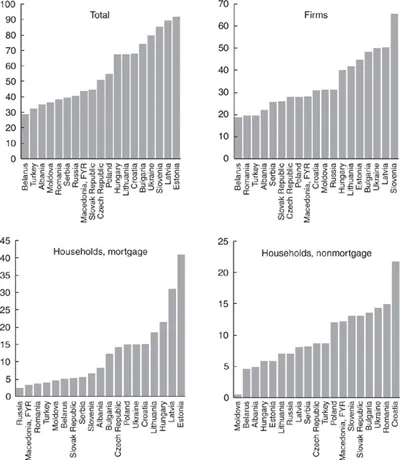
Figure 1.5 Credit Growth
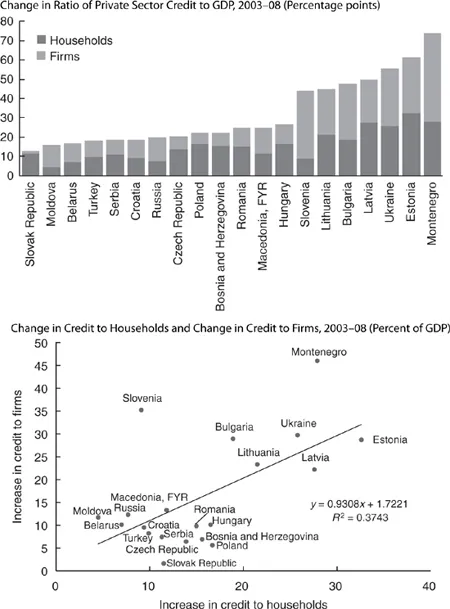
Sources: European Bank for Reconstruction and Development; and IMF staff calculations.
Figure 1.6 Credit to GDP Ratio, 2008
(Percent)
Source: European Bank for Reconstruction and Development.
The credit boom was fueled and financed by unprecedented capital inflows (Figure 1.7). Emerging Europe as a whole had been the beneficiary of large capital inflows since the late 1990s. With low wages and low capital labor ratios, returns on investment in emerging Europe were very high (Lipschitz, Lane, and Mourmouras, 2002). Capital inflows were further stimulated by post-transition reforms. Countries that reformed most during the 1995–2007 period received the largest capital inflows (Figure 1.8). From 2003 onward, push factors—low interest rates in advanced economies and low global risk aversion—further boosted capital inflows, as did the dismantling of barriers to capital f...
Table of contents
- Cover Page
- Title Page
- Copyrights Page
- Contents
- Foreword
- Acknowledgments
- Introduction and Overview
- Part I Prelude to the Crisis
- Part II The Crisis: Regional Perspectives
- Part III Country Experience in Countries With imf Arrangements
- Part IV Country Experience in Other Countries
- Part V Toward Renewed and Sustainable Growth: A Policy Agenda
- References
- Contributors
- Index
- Footnotes