NONE
eBook - ePub
Global Financial Stability Report, October 2017 : Is Growth at Risk?
- English
- ePUB (mobile friendly)
- Available on iOS & Android
eBook - ePub
Global Financial Stability Report, October 2017 : Is Growth at Risk?
About this book
Trusted by 375,005 students
Access to over 1.5 million titles for a fair monthly price.
Study more efficiently using our study tools.
Information
Publisher
INTERNATIONAL MONETARY FUNDeBook ISBN
9781484308394
Year
2017Chapter 1. Is Growth at Risk?
Financial Stability Overview
Near-term financial stability risks have declined with the strengthening global recovery, but medium-term vulnerabilities are building as the search for yield intensifies. Risks are rotating from banks to financial markets as spreads and volatility compress while private sector indebtedness rises.
The Global Recovery Is Improving the Near-Term Outlook for Financial Stability
Near-term risks to financial stability continue to decline. Macroeconomic risks are lower (Figures 1.1 and 1.2) amid the global upswing in economic activity, discussed in the October 2017 World Economic Outlook (WEO). Emerging market risks have also declined, underpinned by the pickup in global activity and benign external conditions. This environment of benign macroeconomic conditions and continued easy monetary and financial conditions—but still sluggish inflation—is fueling a marked increase in risk appetite, broadening investors’ search for yield.
Figure 1.1. Global Financial Stability Map: Risks and Conditions
Risk appetite has grown markedly as near-term stability risks have declined.
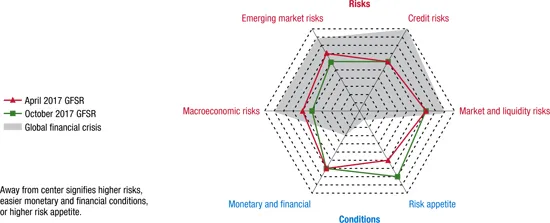
Source: IMF staff estimates.
Note: The shaded region shows the global financial crisis as reflected in the stability map of the April 2009 Global Financial Stability Report (GFSR).
Figure 1.2. Global Financial Stability Map: Assessment of Risks and Conditions
(Notch changes since the April 2017 Global Financial Stability Report)
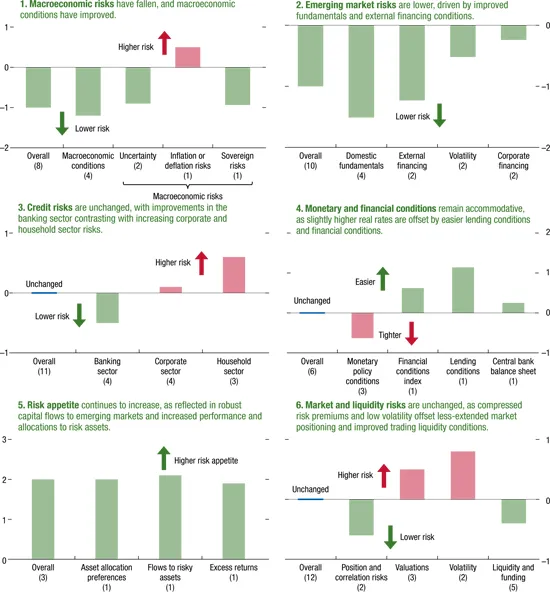
Source: IMF staff estimates.
Note: Changes in risks and conditions are based on a range of indicators, complemented by IMF staff judgment. See Annex 1.1 in the April 2010 Global Financial Stability Report and Dattels and others 2010 for a description of the methodology underlying the global financial stability map. Overall notch changes are the simple average of notch changes in individual indicators. The number in parentheses next to each category on the x-axis indicates the number of individual indicators within each subcategory of risks and conditions. For lending conditions, positive values represent a slower pace of tightening or faster easing.
Systemically Important Banks and Insurers Continue to Enhance Resilience
Global systemically important banks (GSIBs) and insurers have strengthened their balance sheets by raising capital and liquidity but are still grappling with remaining legacy issues and business model challenges. After a painful period of restructuring and absorption of elevated charges for past misconduct in the form of fines and private litigation, the outlook for sustainable profitability is improving, but strategic reorientation remains incomplete. The next section assesses risks from large global banks and life insurance companies.
Medium-Term Vulnerabilities Are Rising and Rotating to Nonbanks
Many asset valuations have continued to rise in response to the improved economic outlook and the search for yield (Figure 1.3, panel 1), driving down a broad range of risk premiums (Figure 1.3, panel 2). While increased risk appetite and the search for yield are a welcome and intended consequence of unconventional monetary policy measures, helping to support the economic recovery, there are risks if these trends extend too far. Compensation for inflation risks (term premiums) and credit risks (for example, spreads on corporate bonds) are close to historic lows, while volatility across asset markets is now highly compressed (Figure 1.3, panel 3). Some measures of equity valuation are elevated, but relative to yields on safe assets (that is, the equity risk premium) they do not appear overly stretched. This prolonged search for yield has raised the sensitivity of the financial system to market and liquidity risks, keeping those risks elevated. The widening divergence between economic and financial cycles within and across the major economies is discussed in Box 1.1.
Figure 1.3. Search for Yield, Asset Valuations, and Volatility
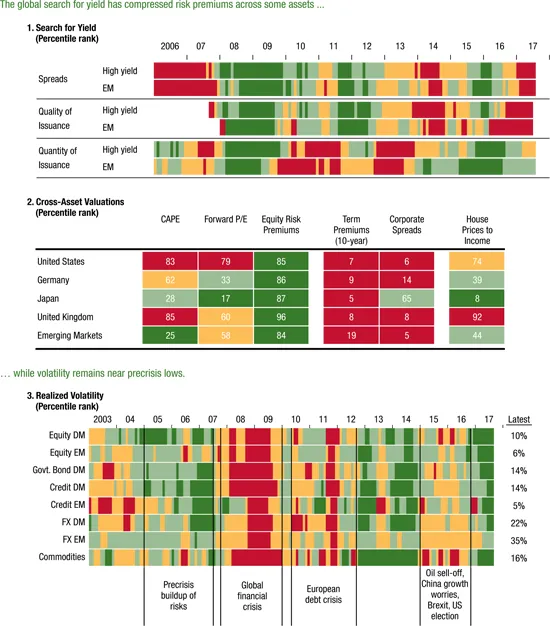
Sources: Bank of America Merrill Lynch; Bloomberg Finance L.P.; Dealogic; Haver Analytics; Organisation for Economic Co-operation and Development; Thomson Reuters; and IMF staff estimates.
Note: The color shading is based on valuation quartiles. Red (dark green) denotes low (high) premiums, spreads, volatility, and issuance quality, as well as high (low) issuance and house price to income. In panel 1, quality of issuance shows spreads per turn of leverage. Quantity of issuance is 12-month trailing gross issuance as percent of the outstanding amount. In panel 2, CAPE is the trailing 12-month price-to-earnings ratio adjusted for inflation and the 10-year earnings cycle. Forward P/E is the 12-month forward price-to-earnings ratio. Equity risk premiums are estimated using a three-stage dividend discount model on major stock indices. Term premium estimates follow the methodology in Wright 2011. Corporate spreads are proxied using spreads per turn of leverage. For house-price-to-income ratio, income is proxied using nominal GDP per capita. The percentile is calculated from 1990 for CAPE, forward P/E, equity risk premiums and term premiums, from 1999 for EM term premiums, from 2000 for house-price-to-income ratio, and from 2007 for corporate spreads. In panel 3, the heatmap shows the percentile of three-month realized volatility since 2003 at a monthly frequency. CAPE = cyclically adjusted price-to-earnings ratio; DM = developed market; EM = emerging market; FX = foreign exchange; Govt = government; P/E = price to earnings.
A key stability challenge is the rebalancing of central bank and private sector portfolios against a backdrop of monetary policy cycles that are not synchronized across countries. Too quick an adjustment in monetary policies could cause unwanted turbulence in financial markets and set back progress toward inflation targets. Too long a period of low interest rates could foster a further buildup of market and credit risks and increase medium-term vulnerabilities.
Credit risks are already elevated, given the deterioration in underlying leverage in the nonfinancial sector—households and firms—of many Group of Twenty (G20) economies. Despite low interest rates, private sector debt service ratios in many major economies have increased to high levels because of rising debt. Weaker households and companies in several countries have become more sensitive to financial and economic conditions as a result.
The Global Recovery Could Be Derailed
Prolonged low volatility, further compression of spreads, and rising asset prices could facilitate additional risk taking and raise vulnerabilities further. Investors’ concern about debt sustainability could eventually materialize and prompt a reappraisal of risks. In such a downside scenario, a shock to individual credit and financial markets well within historical norms could decompress risk premiums and reverberate worldwide, as explored later in this chapter. This could stall and reverse the normalization of monetary policies and put growth at risk.
Large Systemic Banks and Insurers: Adapting to the New Environment
The large internationally active banks at the core of the financial system—so-called global systemically important banks (GSIBs)—have become more resilient since the crisis, with stronger capital and liquidity. Banks have made substantial progress in addressing legacy issues and restructuring challenges—while adapting their business models to the new regulatory and market landscape. Strategic reorientation has led to a pullback from market-related business. Banks have, however, retained a presence in international business and cross-border loans. These strategic realignments have come amid changing group structures, as activity is increasingly channeled through subsidiaries. Despite ongoing improvement, progress is uneven and adaptation remains incomplete. About a third of banks by assets may struggle to achieve sustainable profitability, underscoring ongoing challenges and medium-term vulnerabilities.
Life insurers were hit by the global financial crisis, but have since rebuilt their capital buffers. However, they are now facing the challenge of a low-interest-rate environment. In response, insurers have adapted their business models by changing their product mix and asset allocations. But in doing so, they have been increasingly forced out of their natural risk habitat in a search for yield, making them more vulnerable to market and credit risks. Investors still worry about the viability of some insurers’ business models and find it difficult to assess risks, resulting in weak equity market valuations. Policymakers should seek to strengthen regulatory frameworks and increase reporting transparency.
Global Systemically Important Banks
Global banks remain critical pillars of international financial intermediation. These GSIBs provide a wide range of financial services for companies, institutions, and individuals across many countries.1 Together, these 30 banks hold more than $47 trillion in assets and more than one-third of the total assets and loans of thousands of banks globally. They have an even greater role in certain key global financial functions: collectively they comprise 70 percent or more of certain international credit markets (for example, syndicated trade finance), market services, and the international financial infrastructure. GSIBs are central to the international financial system (Figure 1.4, panel 1).
Figure 1.4. Global Systemically Important Banks: Significance and Business Model Snapshot
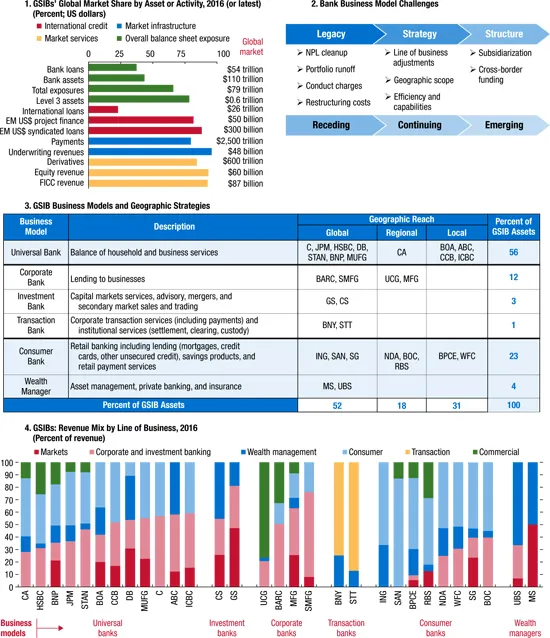
Sources: Bank financial statements; Bank for International Settlements; Basel Committee on Banking Supervision; Bloomberg Finance L.P.; Dealogic; Haver Analytics; Office of Financial Research; S&P Capital IQ; SNL Financial; and IMF staff estimates.
Note: In panel 1, global market size for total exposures, level 3 assets, payments, and over-the-counter derivatives are calculated using the GSIB indicator metrics. “Total exposure” is a proxy for banks’ total asset exposures, which includes total consolidated assets, derivatives exposures, and certain off-balance-sheet exposures. This is the same as the denominator used for the Basel...
Table of contents
- Cover Page
- Title Page
- Copyright Page
- Contents
- Assumptions and Conventions
- Further Information and Data
- Preface
- Foreword
- Executive Summary
- IMF Executive Board Discussion Summary
- Chapter 1 Is Growth at Risk?
- Chapter 2 Household Debt and Financial Stability
- Chapter 3 Financial Conditions and Growth at Risk
- Tables
- Footnotes