NONE
eBook - ePub
World Economic Outlook, April 2006 : Globalization and Inflation
- English
- ePUB (mobile friendly)
- Available on iOS & Android
eBook - ePub
World Economic Outlook, April 2006 : Globalization and Inflation
About this book
Trusted by 375,005 students
Access to over 1.5 million titles for a fair monthly price.
Study more efficiently using our study tools.
Information
Publisher
INTERNATIONAL MONETARY FUNDeBook ISBN
9781589065499
Year
2005CHAPTER I ECONOMIC PROSPECTS AND POLICY ISSUES
Notwithstanding higher oil prices and natural disasters, global growth has continued to exceed expectations, aided by benign financial market conditions and continued accommodative macroeconomic policies. Looking forward, the baseline forecast is for continued strong growth, although—as illustrated in Figure 1.1— risks remain slanted to the downside, the more so since key vulnerabilities—notably the global imbalances— continue to increase. With the risks associated with inaction rising with time, the principal challenge for global policymakers is to take advantage of the unusually favorable conjuncture to address these vulnerabilities. In particular, an orderly resolution of global imbalances will require measures to facilitate a rebalancing of demand across countries and a realignment of exchange rates over the medium term, with the U.S. dollar needing to depreciate significantly from current levels, and currencies in surplus countries— including in parts of Asia and among oil producers— to appreciate.
The momentum and resilience of the global economy in 2005 continued to exceed expectations (Table 1.1 and Figure 1.2). Despite higher oil prices and natural disasters, activity in the second half of 2005 was stronger than earlier projected, particularly among emerging market countries; accounting also for statistical revisions in China,1 global GDP growth is estimated at 4.8 percent, 0.5 percentage point higher than projected last September. At the same time, incoming data have been generally positive. Global industrial production has picked up markedly from mid-2005; the services sector remains resilient; global trade growth is close to double-digit levels; consumer confidence and labor market conditions are strengthening; and forward-looking indicators, notably business confidence, have risen (Figure 1.3).
Table 1.1. Overview of the World Economic Outlook Projections
(Annual percent change unless otherwise noted)
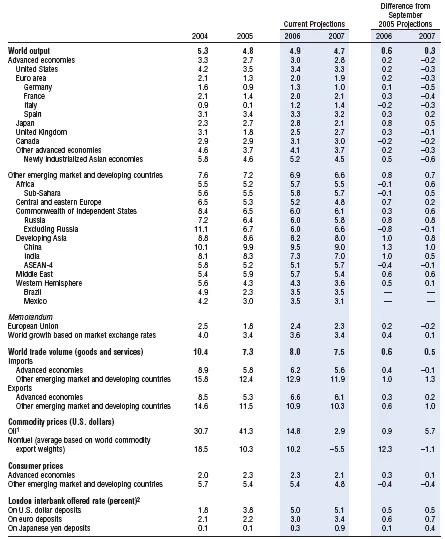
Note: Real effective exchange rates are assumed to remain constant at the levels prevailing during February 9–March 9, 2006. See Statistical Appendix for details and groups and methodologies.
1 Simple average of spot prices of U.K. Brent, Dubai, and West Texas Intermediate crude oil. The average price of oil in U.S. dollars a barrel was $53.35 in 2005; the assumed price is $61.25 in 2006, and $63.00 in 2007.
2 Six-month rate for the United States and Japan. Three-month rate for the euro area.
Figure 1.1. Prospects for World GDP Growth1
(Percent)
Global growth is projected to remain about 4¾ percent in 2006 and 2007, but the risks are slanted to the downside, the more so as time progresses (see text for a detailed discussion).
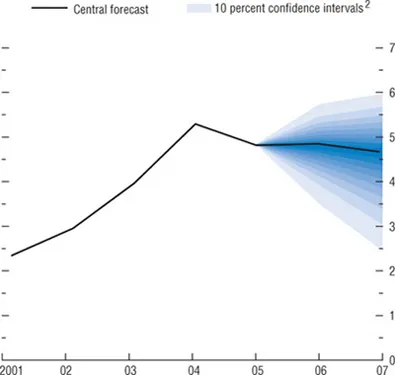
Source: IMF staff estimates.
1 This so-called fan chart shows the uncertainty around the World Economic Outlook central forecast with the 90 percent probability interval. See Box 1.3 for details.
2 Shaded areas of the same gradient above and below the central forecast add up to 10 percent.
Box 1.3. How Accurate Are the Forecasts in the World Economic Outlook?
A recent report commissioned by the IMF’s Research Department evaluated the accuracy of the forecasts published in the World Economic Outlook (WEO), and made a number of recommendations for improving forecasting at the IMF (see Timmermann, 2006). The report— written by Allan Timmermann of the University of California, San Diego—is the fourth in a series of such evaluations (following Artis, 1997; Barrionuevo, 1993; and Artis, 1988).1 This box discusses the findings of the report and the steps that are being taken to implement the report’s recommendations.
Assessing the WEO Forecasts
As a first step, the report looked at the forecasting performance for five key variables—real GDP growth, inflation, the current account balance, and import and export volume growth— for 178 countries in seven economic regions (Africa, central and eastern Europe, the Commonwealth of Independent States (CIS) and Mongolia, Developing Asia, Middle East, Western Hemisphere, and Advanced Economies) since 1990. The analysis considered current-year and next-year forecasts published in the April and September issues of the World Economic Outlook (e.g., the April and September 2005 issues of the WEO have projections for 2005—current year—and 2006—next year). Overall, the report found that the World Economic Outlookforecasts for variables in many countries meet the basic forecasting quality standards in some, if not all, dimensions.2 The report, however, also raised important issues that are discussed below on a variable-by-variable basis.
- Real GDP growth. WEO forecasts for real GDP growth display a tendency for systematic over-prediction. Looking at the G-7 countries, WEO forecasts systematically and significantly overpredicted economic growth for the European and Japanese economies during 1991–2003. In contrast, U.S. growth was underpredicted after 1990, although the bias was not statistically significant. In Africa, central and eastern Europe, the CIS, and the Middle East, growth in individual countries is, on average, overpredicted by more than 1 pecentage point in both current- and next-year forecasts. That said, more than four-fifths of these biases are not statistically significant, which largely reflects the high volatility in the underlying growth series. For IMF program countries, growth was, on average, overestimated by about 0.9 percentage point in April current-year forecasts and by 1½ percentage points in April next-year forecasts, often significantly so.
- Inflation. The report found a bias toward underprediction of inflation, with these biases significant in the next-year forecasts in the case of many African, central and eastern European, and Western Hemisphere countries. The bias tends to be smaller in the current-year forecasts.
- External current account balances. Fewer problems were found in the forecasts for current account balances, except that in some cases the April next-year forecast errors were significantly biased or serially correlated.
As well as assessing the performance of the WEO projections against standard benchmarks of forecast performance, the report also compared them to the Consensus Forecasts, a widely used source that compiles the forecasts of economists working in the private sector. The analysis covered the G-7 economies, seven Latin American economies, and nine Asian economies. Overall, the performance of the WEO forecasts was similar to the Consensus Forecasts—for example, the current year WEO forecasts of GDP growth in the G-7 economies were generally less biased than the Consensus Forecasts, but the bias in the next-year forecasts was stronger in the WEO than in the Consensus.
Recommendations
The report made a number of recommendations to improve the WEO forecasting process. These included: (1) WEO growth forecasts for some countries could be improved if more attention were paid to important international linkages, particularly with the United States;(2) the accuracy of the forecasts should be assessed on an ongoing basis by instituting a set of real-time forecasting performance indicators;(3) IMF forecasters should more carefully consider the historical forecast “biases” when making their forecasts; and (4) the forecast process should be broadened to more explicitly consider the risks around the key central projections. Internally, the IMF has begun taking steps to implement the first three recommendations. The rest of this box discusses the fourth recommendation—forecast risks—and how these can be incorporated in the WEO process.
The increased use of policy targets for key macroeconomic variables—especially inflation— that are not fully under the control of policymakers and advances in econometric methodology have led to a more intense scrutiny of forecast uncertainty in recent years. For example, the Bank of England uses “fan charts” to illustrate the bank’s view about the uncertainty around its central forecast path for inflation. Similarly, the Congressional Budget Office in the United States has started using fan charts to illustrate the uncertainty in its projection of the budget deficit. These fan charts are diagrams that represent forecasts of the probability distributions of variables of interest. The aim of such charts is to depict in a practical way the uncertainty that exists about future economic outcomes.
The fan chart in Figure 1.1 shows the IMF staff’s assessment of the range of uncertainty around the central WEO projection for global real GDP growth in 2006–07. Specifically, it shows the 90 percent probability interval for growth outcomes in 2006–07. Past forecast performance and judgment about the current balance of risks,3 as discussed in the main text, provide the inputs for the construction of the fan chart. In addition to uncertainty about the future course of oil prices, the U.S. housing market, corporate investment, and the future resilience of emerging market growth, two low probability, but high cost, events—an avian flu pandemic and the disorderly unwinding of current account balances—are also considered. The fan chart builds on the two-piece normal distribution used by the Bank of England in its inflation forecast. This distribution, unlike the standard normal distribution widely used in forecasting, allows for asymmetric probabilities below and above the central forecast.4 In the case of the balance of risk being tilted to the downside—which is the view of IMF staff at this juncture—the expected probability of outcomes being below the central forecast exceeds 50 percent. As shown in Figure 1.1, the downside risks are expected to increase somewhat over time, in part reflecting the gradually increasing probability of a disorderly adjustment in global imbalances in the absence of policy action.
Note: The main authors of this box are Nicoletta Batini, Tim Callen, and Thomas Helbling.
1 Other studies of the World Economic Outlook forecasts include Batchelor (2001), Beach, Schavey, and Isidro (1999), and U.S. GAO (2003).
2 These dimensions are that the forecast should be unbiased and serially uncorrelated, that no current information should be able to predict future forecast errors, and that the variance of forecast errors should decline as more information becomes available.
3 Recent current-year and next-year forecast errors provide important information about the extent of forecast uncertainty.
4 See Britton, Fisher, and Whitley (1998); and Wallis (2004).
Figure 1.2. Global Indicators1
(Annual percent change unless otherwise noted)
Global growth remains noticeably above the historical trend, while inflation and long-run interest rates are unusually low.
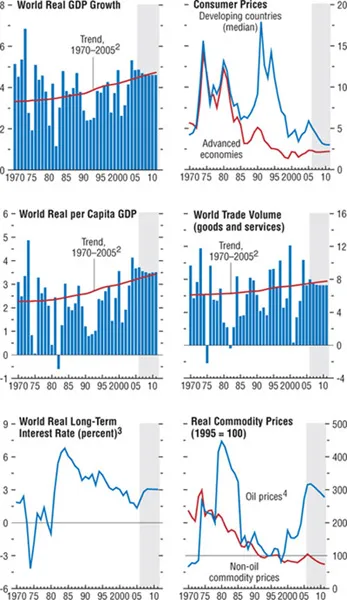
1 Shaded areas indicate IMF staff projections. Aggregates are computed on the basis of purchasing-power-parity (PPP) weights unless otherwise noted.
2 Average growth rates for individual countries, aggregated using PPP weights; the aggregates shift over time in favor of faster-growing countries, giving the line an upward trend.
3 GDP-weighted average of the 10-year (or nearest maturity) government bond yields less inflation rates for the United States, Japan, Germany, France, Italy, the United Kingdom, and Canada. Excluding Italy prior to 1972.
4 Simple average of spot prices of U.K. Brent, Dubai Fateh, and West Texas Intermediate crude oil.
Figure 1.3. Current and Forward-Looking Indicators
(Percent change from a year ago unless otherwise noted)
Global industrial production has turned up, while business and consumer confidence are generally improving.
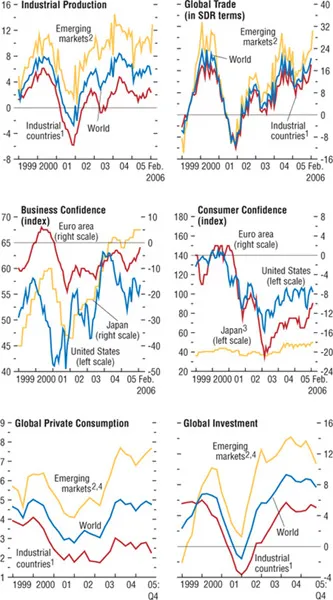
Sources: Business confidence for the United States, the Institute for Supply Management; for the euro area, the European Commission; and for Japan, Bank of Japan. Consumer confidence for the United States, the Conference Board; for the euro area, the European Commission; and for Japan, Cabinet Office; all others, Haver Analytics.
1 Australia, Canada, Denmark, euro area, Japan, New Zealand, Norway, Sweden, Switzerland, the United Kingdom, and the United States.
2 Argentina, Brazil, Bulgaria, Chile, China, Colombia, Czech Republic, Estonia, Hong Kong SAR, Hungary, India, Indonesia, Israel, Korea, Latvia, Lithuania, Malaysia, Mexico, Pakistan, Peru, the Philippines, Poland, Romania, Russia, Singapore, Slovak Republic, Slovenia, South Africa, Taiwan Province of China, Thailand, Turkey, Ukraine, and Venezuela.
3 Japan’s consumer confidence data are based on a diffusion index, where values greater than 50 indicate improving confidence.
4 Data for China, India, Pakistan, and Russia are interpolated.
From a regional per...
Table of contents
- Cover Page
- Title Page
- Copyright Page
- Contents
- Assumptions and Conventions
- Preface
- Foreword
- Chapter I Economic Prospects and Policy Issues
- Chapter II Oil Prices and Global Imbalances
- Chapter III How Has Globalization Affected Inflation?
- Chapter IV Awash With Cash: Why are Corporate Savings So High?
- Annex I Imf Executive Board Discussion of the Outlook, March 2006
- Statistical Appendix
- World Economic Outlook and Staff Studies for the World Economic Outlook, Selected Topics, 1995–2006
- Boxes
- Footnotes