This reissue, first published in 1969 brings together structural and analytical studies of seven single African countries, together with two studies of groups of countries which, although politically separate, have in the past had close economic links. These countries are Algeria, Cameroon, Ghana, Ivory Coast, Liberia, Nigeria and the Sudan. The groups are East Africa, comprising Kenya, Uganda and Tanzania; and Central Africa, comprising Rhodesia, Malawi and Zambia.The countries have been chosen to bring out the main contemporary economic issues arising in the efforts of the independent African States to achieve economic growth. The book will be invaluable to students and practicing economists concerned with Africa and the developing economies generally.

- 524 pages
- English
- ePUB (mobile friendly)
- Available on iOS & Android
eBook - ePub
The Economies of Africa
About this book
Trusted by 375,005 students
Access to over 1.5 million titles for a fair monthly price.
Study more efficiently using our study tools.
Information
Subtopic
Business GeneralIndex
Economics1
INTRODUCTION
The group of countries collectively known as 'under-developed', or 'developing' or 'the third world' have several problems and attitudes in common. A natural desire for generality in the analysis of their problems, however, sometimes hinders useful discussion by too great an emphasis on their similarities and too little attention to their differences. Economists who have worked in one region soon find they have to discard several preconceptions when they begin work in another. The issues in India and Togo are not identical. Even within a region, problems and priorities vary considerably. One of the aims of the comparative studies in this book is to provide material whereby similarities and differences within Africa can be assessed.
A number of factors were considered in the choice of countries to be studied. South Africa was excluded as a special case. Countries from both the 'anglophone' and 'francophone' groups were needed. The economic structure of African countries varies from relatively primitive to relatively advanced levels and examples throughout the range were desired. Their approach to economic problems also varies, from laissez-faire to 'dirigiste' socialist direction. Some countries continue to have at least some 'settlers', whereas in others the expatriates, apart from a residue of former colonial administrators, are mainly transient, being diplomats, representatives of international firms or aid workers. In some areas federal issues or integration arrangements are important, or seem likely to become so. Since statistical data are essential for any useful study, the existence of a certain minimum of such data was a precondition for selection. A final requirement was that the chosen countries should be widely spread geographically.
This geographical spread is shown on Map 1. Three of the nine countries are francophone (Ivory Coast, Cameroon Federal Republic, Algeria). Federal or common market issues are important in East Africa, Central Africa, Nigeria, Ivory Coast and Cameroon, and Algeria. The Liberian economy is, except for its plantation and mining enclaves, relatively primitive, whereas that of Ghana is sufficiently developed for inter-industry analysis to be of some interest in planning. The Ivory Coast has a generally laissez-faire attitude towards economic policy, whereas Algeria and Ghana (for most of the period covered) were directed economies. Settlers continued to be important in East and Central Africa, and in Algeria their departure altered the whole economic structure.
Detailed statistical data are presented in the country studies. Some of it, supplemented by other data, is utilized in this Introduction. It seems desirable to preface this with some general comments on the limitations of the statistical data, in particular for comparative purposes. Since most of the country studies lean heavily on national accounts data, comment will be focused on these, but much of it applies also to other statistical data as well.
It is a common practice to employ national income data as an indicator of differences in or changes in, real income within a country. In such a context, to estimate changes in real income over time first requires that correction should be made for price changes. There are of course many difficulties involved in equating changes in national product at constant prices with changes in real income or welfare. Some of these revolve around the problem of changes in tastes and in the nature and quality of products. Other problems are that some parts of the national product like government and defence are only tenuously linked with what is usually associated with the term 'levels of living' whereas, on the other hand, many aspects of real income find no place in national product calculations.
Similar difficulties in an extreme form confront attempts to use national income data as guides to levels of real income in different countries at a particular point in time. One basic problem in using national product data as an indicator of relative real incomes on an international basis arises from the inappropriateness, for well known reasons, of exchange rates as indicators of the internal purchasing powers of the respective currencies. An indication of this problem is provided by the following figures which relate to Cameroon and Nigeria. Before the establishment of the Federal Republic of Cameroon in 1961, its western member formed part of the Nigerian currency area.
1958 GDP per capita ($)
| Cameroon | Nigeria | Ratio: Cameroon/Nigeria | |
| Converted by official exchange rate | 92 | 48 | 1.92 |
| Converted by UN parity rate | 65 | 58 | 1.12 |
Source: U.N. Yearbook of National Accounts, 1965, Tables 9A and 9B.
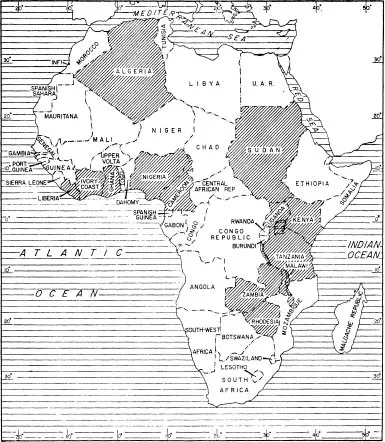
Map 1. Africa.
But even if 'real' product estimates are arrived at for different countries by conventional methods1 or by less conventional methods2 is it justifiable to use the indicated levels of per capita income to imply corresponding differences in welfare? Although such a procedure may not be too misleading if adopted for countries with similar backgrounds and at similar levels of development it may not be helpful if employed for comparisons between countries at very different levels of development any more than domestic real product figures would be as a guide to living standards in Britain for periods as far removed as, say, 1850 and 1950.
One of the biggest problems arises because of differences in consumption patterns. Between countries, differences in consumption patterns reflect partly differences in price structures, but also differences in tastes and 'need'. One attempt to get round the problem of international comparisons of income takes into account need. For instance, since people in hot countries do not need heating it may be argued that resources used in a cold country for heating should be excluded from its income for purposes of comparison. Using this approach and taking into account also differences in coverage and in valuation, Usher3 reduces the ratio of per capita income in the UK and Thailand from 14 to 1 to about 2.5 to one. The calculation is revealing but it evidently depends on subjective judgements about need on which opinions may differ.
Another important point which must be borne in mind when using national product estimates for comparative purposes is that different countries employ different criteria for determining the extent of subsistence production which should be included in the calculations, and that practice varies in the valuations placed upon such production.4 For instance, the treatment of traditional house building in rural areas and of beer brewing has been different in different countries and—in some cases—different at different times in the same country. The varying treatment of items such as these gives rise to substantial differences in the resulting estimates.
Another difficulty in the comparative use of national accounts data arises from differences in presentation which arise in part from different solutions to conceptual problems. Such differences are particularly important in Africa, where differences in the French and British systems have been carried over into the anglophone and the francophone countries. Only major differences can be mentioned here.1 The most common aggregate in anglophone countries is Gross Domestic Product (GDP). The nearest comparable figure in the French system is Production Intérieure Brute (PIB). The main difference between the measures is that wages and salaries paid to workers in central and local government, certain other public and private nonprofit making institutions and the wages of domestic servants are all excluded from PIB but are included in GDP. Also, PIB is calculated at market prices whereas although GDP may also be calculated at market prices, the factor cost basis is more commonly used in Africa. Another difference of importance is that the French system employs a commodity rather than an industrial classification. Resource availability and use are compared in terms of a commodity classification. Some of the differences between the two systems may become less important when the new UN System of National Accounts adapted for Africa is generally adopted. At present they considerably handicap comparative studies.
Finally, the purely statistical limitations of the data must be borne in mind, with particular reference to the quality of the estimates and of possible errors in compilation. These limitations apply of course to all the statistics employed in this book, not merely the national accounts data, and to national, as well as to comparative analysis. It is often impossible to get comparable figures for any considerable time period. Many entries in annual series are derived by making approximate adjustments to previous and sometimes already ancient figures rather than from the results of regular current enquiries. This should be remembered in particular in relation to estimates of subsistence production. The quality of the estimates is also particularly important in the case of traditional capital formation. Whereas in most African countries capital formation by the Central government and the modern private sector is recorded adequately, capital investment by local government and by peasant farmers in land clearing and improvement, tree crops and livestock is either poorly estimated or altogether overlooked. These deficiencies are particularly serious in view of the widespread use of average and incremental capital output ratios for planning and plan evaluation.
Despite all these limitations the statistics can be used to illuminate many aspects of structure and development: but care is needed to distinguish the cases where the light they shed is relatively clear and steady from those where it flickers and almost goes out.
THE PHYSICAL, DEMOGRAPHIC AND ECONOMIC BACKGROUND
Africa has an area of about 11·7 mn. sq. miles and forms about 22 per cent of the world's land area. Its population is estimated at about 300 mn. (about 9 per cent of the world total). Corresponding totals of areas and populations of the countries included in the studies collected here are nearly 4 mn. sq. miles and 130 mn. people. Although the areas of some African countries are large—Sudan and Libya have areas of about 1 mn. and 700,000 sq. miles and together are nearly half the size of China or the USA—their populations are usually small. The most populous country is Nigeria which has a population of some 50 mn. The average population of African countries is just over 5 mn. and is thus about 35 per cent of the average for the world as a whole. The distribution of all African countries by population size, and of those countries selected for this volume is shown in Table 1.
Table 1. African countries by population size, 1963
| All countries | Countries selected for study | |
| Under 1 million | 3 | — |
| 1 — | 20 | 5 |
| 5 — | 5 | 4 |
| 10— | 4 | 3 |
| 15— | 1 | — |
| 20— | 1 | — |
| 25—30 | 1 | — |
| About 50 | 1 | 1 |
Note: Excludes South Africa and countries shown in source as 'Non-sovereign' (except Rhodesia).
Source: U.N. Demographic Yearbook 1964, Table 1, New York, 1965.
Population size has an important bearing on the size of the market. From other standpoints, such as agricultural development, population density is more relevant. The population density for Africa is about 25 a square mile, but the figures for individual countries vary greatly from 2-3 a square mile in arid countries such as Libya to about 280 a square mile in Rwanda. The range of densities within each country is also wide. The overall rate of population growth is high, at about 2·4 per cent a year. Its range in the countries dealt with here is from 1 to 3·2 per cent, and the median figure is 2·5 per cent. One of the implications of such rapid rates of growth is that a high proportion of the population—from 40 to 50 per cent—is under 15.
An important consequence of the high rates of population growth is that increases in per capita income have been held back. Table 2 summarizes data on the annual rates of growth. There are statistical incomparabilities, but the general picture is one of relatively large rates of aggregate growth in terms of current prices. If these rates of change are corrected for price changes, the rates of real growth are generally lower (Zambia is an exception) but are still sizeable. The median rate of increase is 4·5 per cent a year, which would lead to a doubling of total income in sixteen years. Per capita rates of real growth are much lower, the median figure being 1·8 per cent. At this rate 39 years would be required to double income. Nevertheless, the rates of growth are not negligible an...
Table of contents
- Front Cover
- Half Title
- Title Page
- Copyright
- Title Page
- Copyright
- PREFACE
- CONTENTS
- MAPS
- ABBREVIATIONS USED FOR INSTITUTIONS IN FRANCOPHONE COUNTRIES
- NOTES ON CONTRIBUTORS
- 1 Introduction
- 2 The Economy of Ghana
- 3 The Economy of Nigeria
- 4 The Economy of the Ivory Coast
- 5 The Economy of Cameroon Federal Republic
- 6 The Economy of Liberia
- 7 The East African Economies
- 8 The Economy of Central Africa
- 9 The Economy of Sudan
- 10 The Economy of Algeria
- INDEX
Frequently asked questions
Yes, you can cancel anytime from the Subscription tab in your account settings on the Perlego website. Your subscription will stay active until the end of your current billing period. Learn how to cancel your subscription
No, books cannot be downloaded as external files, such as PDFs, for use outside of Perlego. However, you can download books within the Perlego app for offline reading on mobile or tablet. Learn how to download books offline
Perlego offers two plans: Essential and Complete
- Essential is ideal for learners and professionals who enjoy exploring a wide range of subjects. Access the Essential Library with 800,000+ trusted titles and best-sellers across business, personal growth, and the humanities. Includes unlimited reading time and Standard Read Aloud voice.
- Complete: Perfect for advanced learners and researchers needing full, unrestricted access. Unlock 1.5M+ books across hundreds of subjects, including academic and specialized titles. The Complete Plan also includes advanced features like Premium Read Aloud and Research Assistant.
We are an online textbook subscription service, where you can get access to an entire online library for less than the price of a single book per month. With over 1.5 million books across 990+ topics, we’ve got you covered! Learn about our mission
Look out for the read-aloud symbol on your next book to see if you can listen to it. The read-aloud tool reads text aloud for you, highlighting the text as it is being read. You can pause it, speed it up and slow it down. Learn more about Read Aloud
Yes! You can use the Perlego app on both iOS and Android devices to read anytime, anywhere — even offline. Perfect for commutes or when you’re on the go.
Please note we cannot support devices running on iOS 13 and Android 7 or earlier. Learn more about using the app
Please note we cannot support devices running on iOS 13 and Android 7 or earlier. Learn more about using the app
Yes, you can access The Economies of Africa by Peter Robson,D Lury,D A Lury in PDF and/or ePUB format, as well as other popular books in Economics & Business General. We have over 1.5 million books available in our catalogue for you to explore.