In this essay we investigate both statistically and analytically the relative share of manual labour in the national income. From the social point of view it would be more interesting to consider the share of labour as a whole: but it is the relative share of manual labour which is suitable for theoretical analysis.
For the same reason the national income is here given a slightly unorthodox meaning. First, as we are interested in the home produced income alone, we exclude from national income that part which is derived from foreign investments. Further, we shall deal with gross income, by which is meant the income before deductions for maintenance and depreciation (gross income = net income + maintenance and depreciation).2
It is easy to see that the gross national home-produced income is equal to the value added by all industries of an economy. Usually the Government1 is treated as an “industry” producing public services, but we shall not adopt this procedure here. Instead we shall mean by national income the total value added by private enterprises which we denote below by A.
THE STATISTICAL DATA
1. The figures for Great Britain are based on Professor Bowley’s Wages and Income in the United Kingdom since 1860, and Mr. Colin Clark’s National Income and Outlay.
Using Professor Bowley’s data on the distribution of national income (pp. 92, 139) and deducting from the total income the income from overseas (mentioned on p. 96) we obtain the relative share of manual labour2 in home-produced income: 41·4 per cent in 1880, and 39·4 in 1913. These figures are for relative shares in net income; Professor Bowley does not give data on depreciation and gross income. The rate of increase of gross income in the period, 1880–1913, is, however, unlikely to differ much from that of net income; for the proportion of depreciation to net income in 1913 was only about 8 per cent, and the changes in the volume of capital equipment and in the national income between 1880 and 1913 were such that this percentage could not have undergone a great proportionate change within this period.1 Thus the relative share of manual labour in gross income must have altered within the period in question similarly to that in net income. Professor Bowley’s figures of national income contain also the value of Governmental services, which should strictly be excluded for our present purpose, but this would for similar reasons only slightly alter the trend of the relative shares of manual labour from 1880 to 1913.2 Thus it can be concluded from the above that the change in the relative share of manual labour in the national income in our sense (value added by private enterprises) was small.
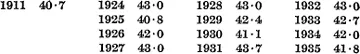
The figures for 1911 and 1924–35 are obtained from Mr. Colin Clark’s data on “Distribution of Income between Factors of Production, 1911 and 1924–35” (National Income and Outlay, p. 94), and on depreciation (pp. 86, 169), and expenditure on Governmental services (p. 141) in these years. The relative shares here calculated differ from those given by Mr. Clark (p. 94) in that they are taken in relation to gross home-produced income, from which expenditure on public services has been excluded.
TABLE 1
Relative Share of Manual Labour1in the National Income of Great Britain
We see that the relative share of manual labour in the national income in Great Britain showed a remarkable stability both in the long run and in the short period.
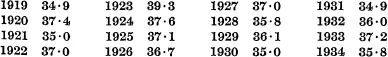
2. The figures for the U.S.A. are based on Dr. King’s The National Income and Its Purchasing Power, 1909–1928, and Dr. Kuznets’ National Income and Capital Formation, 1919–1935.
The relative share of wages2 in the net national income3 was, according to Dr. King, 37·9 per cent in 1909 and 40·2 in 1925. The change in the relative share of manual labour in the gross income less “Government produced” services was probably not very different.
For the period 1919–34 Dr. Kuznets’ estimates are used. It is easy here to calculate “national income” in our sense. We take “income produced” by private industries including depreciation and maintenance (pp. 14, 80). A difficulty arises, however, in connection with wages being estimated separately only in “selected industries”: agriculture, mining, manufacturing, construction, and railways; for other industries they are given jointly with salaries (pp. 62–67).
In 1925 the wage bill in the “selected industries” mentioned above was $17 milliards, while the total wage and salary bill (excluding Governmental employees) was about $44 milliards. But according to Dr. King’s estimate the wage bill in trade, services, etc., amounted in 1925 to about $13 milliards, so that if we admit his figure we obtain: wages in “selected industries” 17, in other industries 13, and total salaries $14 milliards. Now as regards the amplitude of fluctuations, the wages in “other industries” keep the middle position between wages in “selected industries” and total salaries. Thus they are likely to fluctuate more or less proportionately to the total wage and salary bill. With this hypothesis it is possible to estimate roughly the wage bill in “other industries” throughout the period considered. Adding the results to the wage bill in “selected industries” as given by Dr. Kuznets, we obtain the hypothetical total wage bill in the period 1919–34 and find its relative share in the national income. The figures obtained are given in the following table.
TABLE 2
Relative Share of Manual Labour1in the National Income of U.S.A.
These figures represent of course only a rough estimate, but they are adequate in order to show the stability of the relative share of manual labour in the period considered.
We see that in the U.S.A., as in Great Britain, the relative share of wages in the national income shows but small variations both in the long run and in the short period. We shall now try to explain this “law,” and to establish the conditions under which it is valid.
THE DEGREE OF MONOPOLY AND THE DISTRIBUTION OF THE PRODUCT OF INDUSTRY
1. Let us consider an enterprise with a given capital equipment which produces at a given moment an output x and sells it at a price p.1
If we denote the entrepreneurial income (inclusive of dividends) per unit of output by ea, the average “overhead” costs (interest, depreciation, and salaries) by oa and the average wage and raw material cost by wa and ra respectively, we have:
P = ea + oa + w a + ra
Further, the short-period marginal costs m (i.e. the cost of producing an additional unit of product with a given capital equipment) is made up of the sum of the short-period marginal cost of “overheads” om, wages wm, and raw materials rm.
m = om + wm + rm
We subtract the second equation from the first and obtain:
Following Mr. Lerner,1 we shall call the “degree of monopoly” of the enterprise, the ratio of the difference between price and marginal cost to price, or:
If marginal cost is equal to marginal revenue, μ is equal to the inverse of the elasticity of demand for the product of the enterprise. Substituting μ for
in the equation (1), and multiplying both sides by the output x we get:
xpμ = xea + x(oa – om) + x(wa – wm) + x(ra – rm).
Such an equation can be written for each enterprise of an economy. Adding the equations for all enterprises we obtain:
The sum Σxea is the aggregate entrepreneurial income (inclusive of dividends). Further, the marginal “overhead” cost is in general small in comparison with the average cost; thus Σx(oa – om) can be represented by (1 – β)O, where O is the aggregate overhead cost (interest, depreciation, and salaries), and β a small positive fraction. The average cost of raw materials can be supposed approximately constant and consequently the sum Σx(ra – rm) can be neglected. Most complicated are the...
Table of contents
Cover
Title Page
Copyright Page
Original Copyright Page
FOREWORD
CONTENTS
Part One
Part Two
Index
Frequently asked questions
Yes, you can cancel anytime from the Subscription tab in your account settings on the Perlego website. Your subscription will stay active until the end of your current billing period. Learn how to cancel your subscription
No, books cannot be downloaded as external files, such as PDFs, for use outside of Perlego. However, you can download books within the Perlego app for offline reading on mobile or tablet. Learn how to download books offline
Perlego offers two plans: Essential and Complete
Essential is ideal for learners and professionals who enjoy exploring a wide range of subjects. Access the Essential Library with 800,000+ trusted titles and best-sellers across business, personal growth, and the humanities. Includes unlimited reading time and Standard Read Aloud voice.
Complete: Perfect for advanced learners and researchers needing full, unrestricted access. Unlock 1.5M+ books across hundreds of subjects, including academic and specialized titles. The Complete Plan also includes advanced features like Premium Read Aloud and Research Assistant.
Both plans are available with monthly, semester, or annual billing cycles.
We are an online textbook subscription service, where you can get access to an entire online library for less than the price of a single book per month. With over 1.5 million books across 990+ topics, we’ve got you covered! Learn about our mission
Look out for the read-aloud symbol on your next book to see if you can listen to it. The read-aloud tool reads text aloud for you, highlighting the text as it is being read. You can pause it, speed it up and slow it down. Learn more about Read Aloud
Yes! You can use the Perlego app on both iOS and Android devices to read anytime, anywhere — even offline. Perfect for commutes or when you’re on the go. Please note we cannot support devices running on iOS 13 and Android 7 or earlier. Learn more about using the app
Yes, you can access Essays in the Theory of Economic Fluctuations by M. Kalecki in PDF and/or ePUB format, as well as other popular books in Business & Business General. We have over 1.5 million books available in our catalogue for you to explore.