Kalecki is widely regarded as one of the leading theorists in the Post-Keynesian tradition and Theory of Economic Dynamics is one of his most influential works.
Trusted by 375,005 students
Access to over 1.5 million titles for a fair monthly price.
Short-term price changes may be classified into two broad groups: those determined mainly by changes in cost of production and those determined mainly by changes in demand. Generally speaking, changes in the prices of finished goods are ‘cost-determined’ while changes in the prices of raw materials inclusive of primary foodstuffs are ‘demand-determined.’ The prices of finished goods are affected, of course, by any ‘demand-determined’ changes in the prices of raw materials but it is through the channel of costs that this influence is transmitted.
It is clear that these two types of price formation arise out of different conditions of supply. The production of finished goods is elastic as a result of existing reserves of productive capacity. When demand increases it is met mainly by an increase in the volume of production while prices tend to remain stable. The price changes which do occur result mainly from changes in costs of production.
The situation with respect to raw materials is different. The increase in the supply of agricultural products requires a relatively considerable time. This is true, although not to the same extent, with respect to mining. With supply inelastic in short periods, an increase in demand causes a diminution of stocks and a consequent increase in price. This initial price movement may be enhanced by the addition of a speculative element. The commodities in question are normally standardized and are subject to quotation at commodity exchanges. A primary rise in demand which causes an increase in prices is frequently accompanied by secondary speculative demand. This makes it even more difficult in the short run for production to catch up with demand.
The present chapter will be devoted mainly to the study of the formation of ‘cost-determined’ prices.
Price Fixing by a Firm
Let us consider a firm with a given capital equipment. It is assumed that supply is elastic, i.e. that the firm operates below the point of practical capacity and that the prime costs (cost of materials and wages1) per unit of output are stable over the relevant range of output.2 In view of the uncertainties faced in the process of price fixing it will not be assumed that the firm attempts to maximize its profits in any precise sort of manner. Nevertheless, it will be assumed that the actual level of overheads does not directly influence the determination of price since the total of overhead costs remains roughly stable as output varies. Thus, the level of output and prices at which the sum of overheads and profits may be supposed to be highest is at the same time the level which may be considered to be most favourable to profits. (It will be seen at a later stage, however, that the level of overheads may have an indirect influence upon price formation.)
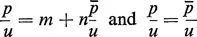
In fixing the price the firm takes into consideration its average prime costs and the prices of other firms producing similar products. The firm must make sure that the price does not become too high in relation to prices of other firms, for this would drastically reduce sales, and that the price does not become too low in relation to its average prime cost, for this would drastically reduce the profit margin. Thus, when the price p is determined by the firm in relation to unit prime cost u, care is taken that the ratio of p to the weighted average price of all firms,
3, does not become too high. If u increases, p can be increased proportionately only if
rises proportionately as well. But if
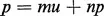
increases less than u, the firm’s price p will also be raised less than u. These conditions are clearly satisfied by the formula
where both m and n are positive coefficients.
We postulate that n < 1 and this for the following reason. In the case where the price p of the firm considered is equal to the average price
we have:
from which it follows that n must be less than one.
The coefficients m and n characterizing the price-fixing policy of the firm reflect what may be called the degree of monopoly of the firm’s position. Indeed, it is clear that equation (1) describes semi-monopolistic price formation. Elasticity of supply and stability of unit prime costs over the relevant range of output is incompatible with so-called perfect competition. For, if perfect competition were to prevail the excess of the price p over the unit prime costs u would drive the firm to expand its output up to the point where full capacity is reached. Thus, any firm remaining in the business would work up to capacity, and the price would be pushed up to the level which equilibrates demand and supply.
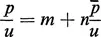
For the analysis of changes in the degree of monopoly it is convenient to use diagrammatic presentation. Let us divide equation (1) by the unit prime cost u:
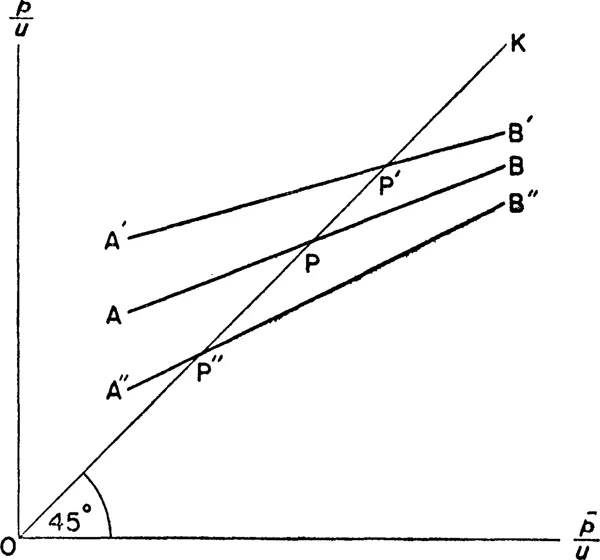
This equation is represented in Fig. 1, where
is taken as abscissa and
as ordinate, by a straight line AB. The inclination of AB is less than 45° because n < 1. The position of this straight line which is fully determined by m and n, reflects the degree of monopoly. When, as a result of change in m and n, the straight line moves up from the position AB to that of A′B′ then to a given average price
and unit prime cost u there corresponds a higher price p of the firm over the relevant range of
. We shall say in this case that the degree of monopoly increases. When, on the other hand, the straight line moves down to the position A″B″ we shall say that the degree of monopoly diminishes. (We assume that m and n always change in such a way that none of the lines corresponding to various positions of AB intersects each other over the relevant range of
).
FIG. 1. Changes in the degree of monopoly.
We may now demonstrate a proposition which is of some importance to our future argument. Let us take into consideration the points of intersection P, P′, P″ of the straight lines AB, A′B′, A″B″ with the line OK drawn through zero point at 45°. It is clear that the higher the degree of monopoly the larger the abscissa of the respective point of intersection. Now this point is determined by the equations:
It follows that the abscissa of the point of intersection is equal to
Consequently a higher degree of monopoly will be reflected in the increase of
and conversely.
In this section and the subsequent one the discussion of the influence of the degree of monopoly upon price formation is rather formal in character. The actual reasons for the changes in the degree of monopoly are examined at a later stage.
Price Formation in an Industry: a Special Case
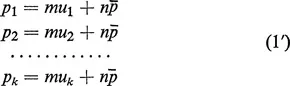
We may commence the discussion of the determination of average price in an industry by considering a case where the coefficients m and n are the same for all firms, but where their unit prime costs u differ. We have then on the basis of equation (1):
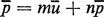
If these equations are weighted by their respective outputs (that is, each multiplied by its respective output, all added and the sum divided by the aggregate output) we obtain:
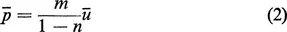
so that
Let us recall that according to the preceding section the higher the degree of monopoly the higher is
. We thus can conclude: The average price
is proportionate to the average unit prime cost ū if...
Table of contents
Cover
Half Title
Title Page
Copyright
Contents
Foreword
Part 1: Degree of Monopoly and Distribution of Income
Part 2: Determination of Profits and National Income
Part 3: The Rate of Interest
Part 4: Determination of Investment
Part 5: The Business Cycle
Part 6: Long-Run Economic Development
Statistical Appendix
Subject Index
Frequently asked questions
Yes, you can cancel anytime from the Subscription tab in your account settings on the Perlego website. Your subscription will stay active until the end of your current billing period. Learn how to cancel your subscription
No, books cannot be downloaded as external files, such as PDFs, for use outside of Perlego. However, you can download books within the Perlego app for offline reading on mobile or tablet. Learn how to download books offline
We are an online textbook subscription service, where you can get access to an entire online library for less than the price of a single book per month. With over 1.5 million books across 990+ topics, we’ve got you covered! Learn about our mission
Look out for the read-aloud symbol on your next book to see if you can listen to it. The read-aloud tool reads text aloud for you, highlighting the text as it is being read. You can pause it, speed it up and slow it down. Learn more about Read Aloud
Yes! You can use the Perlego app on both iOS and Android devices to read anytime, anywhere — even offline. Perfect for commutes or when you’re on the go. Please note we cannot support devices running on iOS 13 and Android 7 or earlier. Learn more about using the app
Yes, you can access Theory of Economic Dynamics by M. Kalecki in PDF and/or ePUB format, as well as other popular books in Business & Business General. We have over 1.5 million books available in our catalogue for you to explore.