![]()
Why are emissions important?
1.1 Global warming and CO2 emissions
1.1.1 A glance at climate change
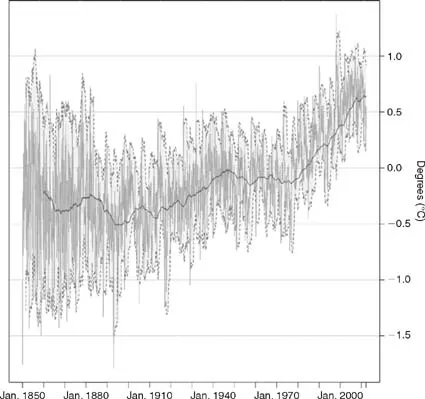
Global warming has become an increasing international concern over the last two decades. In 2001 the International Panel for Climate Change (IPCC) published a detailed report providing relevant proof for the existence of global warming and its anthropogenic causes. The IPCC's report at that time was a powerful incentive to accelerate all efforts for reducing GHG emissions. The report stated that global average surface temperature (the average of near-surface air temperature over land, and sea surface temperature) has increased significantly since 1861; more precisely, the temperature over the twentieth century increased by about 0.6 ± 0.2°C. These numbers take into account various adjustments, including urbanization effects.1 The records of the average global monthly temperature represented in Figure 1.1 show a great deal of variability; for example, most of the warming occurred during the twentieth century, during two periods, 1910–1945 and 1976–2000.
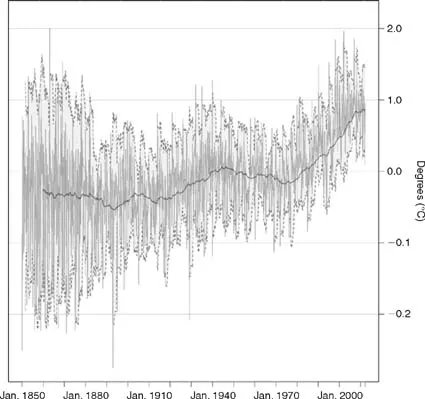
The analyses of weather data for the Northern Hemisphere indicate that the increase in temperature in the twentieth century is likely to have been the largest of any century during the past 1,000 years. It is also likely that, as exhibited in Figure 1.2 in the Northern Hemisphere, the last two decades were the warmest and 1998 one of the warmest years. The moving average over a ten-year rolling window for both global and Northern Hemisphere temperature underline this trend. Because fewer data are available, less is known about annual averages prior to 1,000 years before present and for conditions prevailing in most of the Southern Hemisphere prior to 1861.
On average, between 1950 and 1993 night-time daily minimum air temperatures over land increased by about 0.2°C per decade. This is about twice the rate of increase in daytime daily maximum air temperatures (0.1°C per decade). This has lengthened the freeze-free season in many mid- and high-latitude regions. The increase in sea surface temperature over this period is about half that of the mean land surface air temperature.
Figure 1.1 Global temperature drifts, 1850–2012.
Beyond the increasing trend of the average global temperature, the IPCC report shows other major climate changes. For instance, since late 1950 (the period of adequate observations from weather balloons) the rise of temperature is not only on earth's surface; a rise in temperature is also observed in the lowest 8 km of the atmosphere. Thus, over the past four decades, the overall global temperature increases in the lowest 8 km of the atmosphere and in surface temperature have been similar at 0.1°C per decade.
Since the start of the satellite record in 1979, both satellite and weather balloon measurements show that the global average temperature of the lowest 8 km of the atmosphere has changed by +0.05 ± 0.10°C per decade, but the global average surface temperature has increased significantly by +0.15 ± 0.05°C per decade. The difference in the warming rates is statistically significant. This difference occurs primarily over the tropical and sub-tropical regions.
Figure 1.2 Northern hemisphere temperature drifts, 1850–2012.
The lowest 8 km of the atmosphere and the surface are influenced differently by factors such as stratospheric ozone depletion, atmospheric aerosols and the El Niño phenomenon. Hence, it is plausible to expect that over a short time period (e.g. 20 years) there may be differences in temperature trends. In addition, spatial sampling techniques can also explain some of the differences in trends, but these differences are not fully resolved. Snow cover and ice extent have decreased.
Satellite data show that there are very likely to have been decreases of about 10 per cent in the extent of snow cover since the late 1960s, and ground-based observations show that there is very likely to have been a reduction of about two weeks in the annual duration of lake and river ice cover in the mid and high latitudes of the Northern Hemisphere over the twentieth century.
There has been a widespread retreat of mountain glaciers in non-polar regions during the twentieth century. Northern Hemisphere spring and summer sea-ice extent has decreased by about 10 to 15 per cent since the 1950s. It is likely that there has been about a 40 per cent decline in Arctic sea-ice thickness during late summer to early autumn in recent decades, and a considerably slower decline in winter sea-ice thickness. Global average sea level has risen and ocean heat content has increased. Tide gauge data show that global average sea level rose between 0.1 and 0.2 metres during the twentieth century. Global ocean heat content has increased since the late 1950s, the period for which adequate observations of sub-surface ocean temperatures have been available.
1.1.2 CO2 emissions and the greenhouse effect
Weather observations show with certitude a structural change over the last 100 years, mainly represented by a drift significantly higher than zero. And yet the link between these findings and the increase in the atmospheric CO2 concentration needs to be considered carefully. The main source of heat on Earth's surface is obviously given by the radiative power of the sun.
Roughly one-third of the solar energy that reaches the top of Earth's atmosphere is reflected directly back to space. The remaining two-thirds are absorbed by the surface and, to a lesser extent, the atmosphere. To balance the absorbed incoming energy, the Earth must, on average, radiate the same amount of energy back to space. Because the Earth is much colder than the sun, it radiates at much longer wavelengths, primarily in the infrared part of the spectrum. This thermal radiation emitted by the land and ocean is absorbed by the atmosphere, including clouds, and re-radiated back to Earth. This process reflects at a larger scale the mechanism of a greenhouse.
In a greenhouse the short wavelengths of the visible light spectrum from the sun's radiation pass through a transparent medium and are absorbed by the objects placed inside (i.e. vegetables). At the same time, as a consequence of energy conservation, the heated objects emit radiation with longer wavelengths in the infrared spectrum. This radiation is reflected back by the transparent medium, and thus the infrared radiation is kept in the greenhouse and leads to more heating and an increase in temperature. This mechanism, known as the greenhouse effect, takes place at a much larger scale, but through a different physical process. Retention of the infrared radiation in the atmosphere is due to the presence of specific gases. Nitrogen and oxygen represent almost the totality of the atmosphere, representing 78 per cent and 21 per cent respectively. And yet this major portion of the atmosphere exerts almost no greenhouse effect. The greenhouse effect comes from water vapour as the most important GHG, and carbon dioxide (CO2) as the second most important. Other gas molecules present in infinitesimal amounts, like methane, nitrous oxide and ozone, contribute also to the effect. At the Earth scale, the greenhouse effect warms the surface of the planet. Without the natural greenhouse effect, the average temperature at Earth's surface would be below the freezing point of water, thereby making life as we know it impossible. Several components of the environment, like oceans and living things, affect atmospheric concentrations of GHGs. A prime example of this is CO2 circuiting in the atmosphere as part of the photosynthesis process. Additional important feedback mechanisms involve clouds. Clouds are effective at absorbing infrared radiation and therefore exert a large greenhouse effect, thus warming the Earth. Clouds are also effective at reflecting away incoming solar radiation, thus cooling the Earth. A change in almost any aspect of clouds, such as their type, location, water content, cloud altitude, particle size and shape, or their lifetimes, affects the degree to which clouds warm or cool the Earth. It is important to mention that the impact of the marginal increase in GHGs concentration upon the greenhouse effect is dependent on the region: in dry, cold regions the impact of an additional increase is much higher than in humid, hot regions.
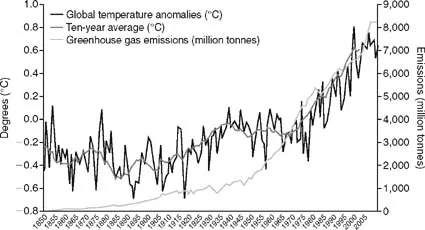
Useful under the natural setup, the greenhouse effect becomes an issue when an increase in the natural process is brought about by human activities. This process is known as enhanced greenhouse effect, whereby due to anthropogenic factors GHGs are released into the atmosphere at a far greater rate than would occur through natural processes, and thus their concentrations are increased. Human activities, primarily the burning of fossil fuels and clearing of forests, have greatly intensified the natural greenhouse effect, causing global warming (Figure 1.3).
In the industrial era human activities added GHGs to the atmosphere, primarily through the burning of fossil fuels and clearing of forests. Adding more of a GHG, such as CO2, to the atmosphere intensifies the greenhouse effect, thus warming Earth's climate. The amount of warming depends on various feedback mechanisms. For example, as the atmosphere warms due to rising levels of GHGs, its concentration of water vapour increases, further intensifying the greenhouse effect. This, in turn, causes more warming, which causes an
Figure 1.3 Average Earth temperature and CO2 emissions from fossil combustion.
additional increase in water vapour, in a self-reinforcing cycle. This water vapour feedback may be strong enough to approximately double the increase in the greenhouse effect due to the added CO2 alone.
1.1.3 Emissions and climate: between facts and controversies
The mechanisms that explain global warming through an increase of human-related carbon dioxide emissions are complex. The statistical evidence relies on datasets recomposed from various sources across different periods of time. For instance, the figures beyond the average global monthly temperature need the consolidation of various average temperature across the globe. When one establishes the average temperature across a geographical region, the question is what weights are considered for each observation. How can one add temperature from various altitudes, or mix ground surface and ocean surface temperature? If we focus on the value of an individual average at one geographical point, what observation would be considered as the temperatures change intra-day? And sometimes the variation between day and night are substantial. The dataset used by various research teams aggregate temperature from 1850 until today, thereby using data collected with a heterogeneous methodology and a broad of various instruments. And last but not least, the bulk of the data include mainly post-industrial revolution observations and tend to ignore the older implied observations from the middle ages. Another issue comes from the perimeter, which defines the anthropogenic carbon emissions. The proposed numbers are heterogeneous, depending on what activities are considered.
Obviously, each of these issues is addressed in an appropriate way by the climatologists or econometrists in order to obtain a homogenous times series across time and space. Nevertheless, these issues are the main points of global warming adversaries. The global warming negationism theories are based on three major conjectures. First, some researchers discuss previous claims that global warming trends by the IPCC are not relevant, given all the post-treatment of initial datasets.
A second theory claims that the actual global warming trend comes after a period of glaciations in the eighteenth century, which was preceded by a very hot middle age, much hotter than the present times. Thus there would be no causality between the anthropogenic carbon emissions and global warming.
A third camp maintains that the influence of carbon emissions resulting from human activities is overstated. They justify this with the idea that natural phenomena like volcano eruption, for instance, produce much more CO2 than fossil-based industries. Nevertheless, on this point a recent study (Gerlach 2011) shows that human emissions are much higher (100 times) than volcano-related ones.
The word “fraud” in the context of global warming appeared way before the actual policy implementations or the opening of organized emission markets. One of the most influential people denying global warming and its effect was US Senator James Inhofe. In a speech delivered in September 2006 in front of the US Senate he presented a detailed report based on works of a team of 60 climate-change sceptics. Other researchers, including the reputed climatologist William Gray, reported their differences with the consensus of the scientific community. On top of that, in 2011 a team of Russian scientists specializing in the research of solar activities predicted a period of global cooling resulting in new mini-glaciations. The team was led by the astrophysicist Habibullo Abdussamatov, head of the Russian segment of the International Space Station, and head of Space Research of the Sun Sector at the Pulkovo Observatory of the Russian Academy of Sciences.
Concerning the long-term drift of climate change, it is probably impossible to give an independent and fair opinion, but if we reduce the perimeter of the study one could find some clear conclusions. If we look at publicly available data (Figure 1.1) series of daily temperatures from major cities of the world over the available time frame (50–60 years) we find a clear upward drift that amplifies over time. Also, time series of sea or ocean levels show a clear increase over the last decades. Snowfall, glacier areas or extreme events frequency data will converge to the finding that global warming is a reality. On the carbon emissions side, relevant proof was found regarding the increasing acidity of oceans due to high concentrations of CO2. Nevertheless, the link between carbon anthropogenic emissions and global warming is not obvious. Looking at the other side of the coin, it appears that the actual global economy is built on the rapid exploitation of fossil energy resources. This intensive exploitation does not lead only to the depletion of the sources, but to a cost for the human habitat from the various pollution forms (CO2 included). It is what economists call negative externalities. The fossil resources concentrated on today in a few countries across the globe tend to be more than commodities and become actual currencies, as probably gold was since ancient times, until the breaking of the gold standard. History shows that massive dependency on one commodity leads to major disequilibria, socially, financially or politically. Thus, the fossil economy produces an increasing number of externalities, not only environment-related ones. The idea of regulating these externalities through a policy based on these assumptions makes a lot of sense. Global warming and the greenhouse effect could be a starting point for a more complex policy. Thus, the various efforts for reducing emissions are probably going in the right direction, but the amplitude or the fine-tuning of this process is open to debate.
1.2 Dealing with negative externalities
The concerns around pollution and environmental issues are not recent. Pollution has been an issue for authorities since the middle ages, gaining momentum after the Industrial Revolution. At the beg...