![]()
Part I
THE SHRINKING NUMBERS
![]()
Chapter One
THE INFLUENCE OF TELEVISION
IT has become commonplace to attribute to television a large share of the blame for the decline of the cinema. This is well founded and will not be challenged in this monograph. But beyond this there are many questions which call for an answer. One of these, which it is hoped to answer in this chapter, relates to the effect of commercial television. Contrary to what is widely believed, it appears that the addition of a second programme has had no substantial effect on the cinema independently and distinctly from the existence of a single programme.
1. Three phases
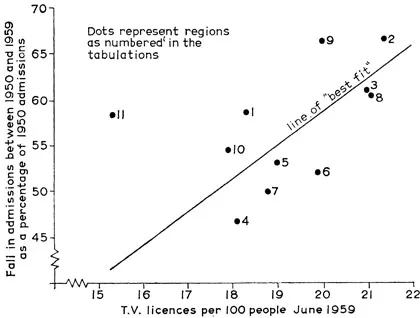
But first let us look in more detail at the connexion between television, whether bbc or commercial, and the fall in cinema admissions. Table 2 shows, by region, the number of TV licences per 100 people in June 1959 and the percentage fall in cinema admissions between 1950 and 1959. By and large, there is a tendency for the percentage fall in admissions to be greater the more widespread the ownership of TV sets. This relationship can be seen best in Diagram 1 on which the data of Table 2 are plotted. With the pronounced exception of Scotland, the dots—each representing a region as numbered in Table 2—lie roughly along a line from South West to North East, indicating that as the number of TV sets grows, the fall of admissions increases. The line which ‘best fits’ the data (excluding Scotland) can be statistically calculated and is inserted in the Diagram.1
TABLE 2
TELEVISION LICENCES AND CINEMA ADMISSIONS BY REGION, 1959 | Region | TV licences per 100 people June 1959 | Fall in cinema admissions between 1950 and 1959 as a percentage of 1950 admissions |
| (number) | (percentage) |
| (1) Northern | 18.3 | 58.5 |
| (2) East and West Ridings | 21.4 | 66.3 |
| (3) North Midland | 21.0 | 60.9 |
| (4) Eastern | 18.1 | 46.4 |
| (5) London and South Eastern | 19.0 | 53.0 |
| (6) Southern | 19.9 | 51.9 |
| (7) South Western | 18.8 | 49.8 |
| (8) Midland | 21.1 | 60.3 |
| (9) North Western | 20.0 | 66.1 |
| (10) Wales | 17.9 | 54.3 |
| (11) Scotland | 15.3 | 58.4 |
| Great Britain | 18.8 | 58.4 |
Sources: TV licences: Computed by the British Radio Equipment Manufacturers’ Association from G.P.O. district by district quarterly returns of TV licences and published in the Commercial TV Yearbook 1960.
Admissions: Computed from Board of Trade returns (see note to Table 8).
Note: Instead of adjusting the second column for changes in population since 1950, the first column has been expressed as so many licences per 100 people enumerated in the 1951 Census. This is the simplest way of removing much of the distorting effect of uneven population changes (which is pronounced only for the fast-growing Eastern and Southern regions) upon the relation of one column to the other. But it means that for other purposes the figures quoted may be slightly misleading.
This, then, confirms the widely held view about the effect of television on the cinema. But it is possible to go a little further and estimate that, excluding Scotland, half the observed variation in the fall of admissions between regions can be ‘explained’ by differences in the extent of TV ownership.
Here we are of course entering into statistical concepts and a word is necessary about their interpretation. The word ‘explained’ is used in the statisticians’ sense to indicate the degree of association between two or more magnitudes, not the causal connexion between them, which can never be ascertained statistically but has to be inferred from other knowledge. In this instance we can of course assert from our other knowledge that a causal relationship between TV and the decline of cinema-going lies at the back of the statistical association. Yet we cannot assert that it lies behind the whole of that association. Other factors, which are themselves associated with the expansion of television, also play a part. In particular, in regions where the penetration of TV has been greatest it has, through its effect on admissions, led to proportionately more cinema closures, 2 and these were, in turn, responsible for a further aggravation of admission losses in these regions. These further losses are an indirect effect of television and would not have occurred but for the closure of cinemas. But there is no statistical technique for separating direct and indirect effects.
To return to the proposition that half the variation in regional admission losses between 1950 and 1959 can be explained in terms of differing levels of TV penetration and its indirect effects, the implication clearly is that other factors must account for the remaining half. This is quite a high residual. But had the same exercise been undertaken with 1958 data, the residual would have been only thirty per cent. Between the two years there appears to have been a change in the importance of increasing television penetration as a factor in the decline of cinema-going. This and other considerations lead to the idea of three phases in the effect of the spreading of TV on admissions.
In the first phase in the early ’fifties a disproportionate number of viewers belonged to the higher income groups.3 Both because their cinema-going was less frequent than that of the working class and because acquisition of a set involved for them a smaller financial burden, the effect on admissions was comparatively small. Nevertheless the decline of admissions in that phase, such as it was (see Table 3), was probably largely attributable to television because, as was noted in the Introduction, there was little or no decline outside reception areas. The second phase, starting roughly in 1955, saw the dramatic expansion of television amongst the working class. In this phase each new set dealt a heavy blow to the cinema. It was not only that television was penetrating into the cinema’s stronghold, the working class, but that it was penetrating into those working class households which could boast the highest cinema-going totals. The reason is that acquisition of a set was financially more practicable in households where younger members provided a second, third or fourth income. This meant that sets were being acquired by families which (a) were larger than average and (b) of an age composition which led to high cinema-going scores. (The 15–24 age group is, as we shall see, by far the most cinema-prone.) This phase of TV penetration was quite disastrous for the cinema, with each new licence responsible for a large number of admission losses. But in the nature of things it could not continue indefinitely. It had to give way to a phase in which the averages worked out the other way, as families small in size and old in age came to be increasingly represented in each year’s new viewers. After 1958, the loss of admissions for each additional TV licence began to decline and the decline may be expected to continue. It is even possible to envisage a stage when each new licence will affect cinema-going only negligibly because it will be issued predominantly to pensioner households, from which the cinema draws very little custom. In this third phase, other factors contributing to the decline of cinema-going would for the first time be less than completely overshadowed by the effect of television.
This outline of the three phases has been deliberately kept to a very broad level. Details of the change from the first to the second phase will be found in the remainder of this chapter. Evidence for the third phase is adduced in Chapter Three.
2. Is commercial TV responsible for the second phase?
We have dated the beginning of the second phase roughly as from 1955. Commercial TV started in the London area in September 1955 and in the Midlands and the North in February 1956. Could this be the cause, at least in part, of the sharp decline of admissions in the second phase?
In almost every interview with exhibitors the writer was told about the hard knock which the industry received from the appearance of the second programme on the home screen. In the data about closures which the Cinematograph Exhibitors’ Association tries to collect, there is a whole string of cinemas for whose closure TV is given as the proximate cause. The pep broadsheet purports to provide statistical backing for this view.4 and Lord Rank even ventured to estimate that ITV was responsible in the first six months of its operation for a 10 per cent, fall of admissions in the areas covered by the earliest ITV stations.5
A priori the argument is plausible. For ...