Explore and work with tools for Biomedical Data Acquisition and Signal Processing Key Features
Get familiar with the working of Biomedical Sensor
Learn how to program Arduino with LabVIEW with ease
Get familiar with the process of interfacing of analog sensors with Arduino Mega
Use LabVIEW to build an ECG Patient Monitoring System
Learn how to interface a simple GSM Module to Arduino
Description Biomedical sensor data acquisition with LabVIEW provides a platform for engineering students to get acquainted with Arduino and LabVIEW programming. Arduino based projects would help to improve the standards of patient care and monitoring in hospitals and the standard of living in cities by implementing a variety of innovative ideas more directly. The goal of this book is to explore and illustrate the programming and interfacing of Arduino with biomedical sensors, communication modules, and LabVIEW GUI. The book begins with essential knowledge and gradually progresses towards the advanced level of comprehension. It starts with a Biomedical sensor-based project with a working model of LabVIEW GUI. It also gives a detailed overview of programming with Arduino IDE and LabVIEW. It covers Interface for Arduino (LIFA), which is a unique contribution that aids in the understanding of embedded systems. This book for high-level students who need application-based knowledge for developing some real-time patient monitoring systems using Arduino and LabVIEW. What will you learn
Learn about the interfacing of Biomedical Sensors
Understand how to create GUI with LabVIEW
Learn about digital and analog sensor interfacing with Arduino
Learn how to load the LabVIEW Interface for Arduino without Firmware
Learn how to Interface LabVIEW with Arduino Board using Firmware
Who this book is for This book is for Students/Professionals looking for a career in the growing field of Biomedical Sensors. This book is also for those who want to get familiar with the basics of E-Healthcare systems. Table of Contents 1. Introduction to Biomedical Signals 2. Introduction to Arduino Mega 3. Digital sensor interfacing with Arduino Mega 4. Display device interfacing with Arduino Mega 5. Analog sensor interfacing with Arduino Mega 6. Introduction to interfacing Arduino and LabVIEW without Firmware 7. GSR sensor module interfacing using Arduino 8. Blood Pressure Sensor Module 9. Respiratory (nasal airflow) sensor module 10. Temperature Sensor Module 11. Body Position Sensor Module 12. Introduction to interfacing Arduino and LabVIEWFirmware 13. ECG Sensor Module with Arduino 14. EMG Sensor Module with Arduino 15. Pulse Oximeter interface with Arduino About the Authors Anshuman Prakash has completed his M.Tech in Embedded systems specialization in wearable technology from University of Petroleum and Energy Studies, Dehradun, India. Dr. Lovi Raj Gupta is the Executive Dean, Faculty of Technology & Sciences, Lovely Professional University. He is a leading light in the field of Technical and Higher education in the country. Dr. Rajesh Singh is currently associated with Lovely Professional University as Professor with more than Sixteen years of experience in academics. Dr. Anita Gehlot is currently associated with Lovely Professional University as Associate Professor with more than twelve years of experience in academics. Rydhm Beri is working as an Assistant Professor in BBK DAV College for Women, Amritsar, since last three years and has 5 years of experience in the field of education.
The term signal refers to the feature of a single or number of variables which taken utilitarian records. A signal is termed as a biological signal when it is captured from the gadget and carries statistics approximately the state or conduct of that device. As an instance, the temperature report of an affected person, the voltage document with the aid of an electrode placed at the scalp, and the spatial sample of X-ray absorption acquired from a CT test are biological signals.
In this chapter, a short introduction approximately the essential nature, characteristics, origin, and recording of the biomedical alerts like EEG, ECG, and the EMG i.e. discussed along with their working principle.
Structure
Introduction to biomedical signals
Origin of biomedical signals
Commonly used biomedical signals
The action potential
The Electrocardiogram
The Electroencephalogram (EEG)
The Electroencephalogram (EEG)
Objectives
To know about the concepts of biomedical signals
To understand the working principles of biomedical sensors
To grasp the idea of action potential
To understand the model architecture of ECG
To capture the working principle of EEG
Introduction to biomedical signals
Biomedical signs are perceptions of physiological exercises of human being, extending from the quality and protein arrangements to neural and heart rhythms to tissue and organ pictures. Processing of biomedical signals targets extricating important data from biomedical signs. Scientists and physicians can find new biology and can monitor different health-related issues by biomedical signal processing.
To sense biomedical signals we need biomedical sensors that help in the identification of disease. Biomedical sensors will be sensors that distinguish restoratively applicable parameters; these could extend from straightforward physical parameters like circulatory strain, temperature, EEG, ECG, etc to analytes for which biosensors are proper.
Origin of biomedical signals
The human body made from several physiological systems for example - respiratory, cardiovascular, nervous system, and many others. Every one of those structures is made up of several subsystems that keep on many physiological processes. Every physiological manner is related to positive kinds of alerts referred to as biomedical alerts that mirror their nature and activities. Particular types of biomedical indicators are:
Bioelectric signals are precise styles of biomedical signals which are received using electrodes that document the versions in electric ability generated with the aid of physiological procedures. Examples of bioelectric signals are:
Electrocardiogram (ECG)
Electroencephalogram (EEG)
Electromyogram (EMG)
Electro-oculogram (EOG), among others.
Viewing these indicators and comparing them to their recognized norms, any sickness/disease is frequently detected. While such measurements are discovered over a time frame, a one-dimensional time-series obtained known as a physiological sign. For example, while a person is tormented by a coronary heart hassle it manner that there are some adjustments in his electrocardiogram (ECG) or changes in blood stress. Another instance is a Neurological disease (which includes epilepsy) where there are modifications in the affected person’s electroencephalogram (EEG).
Commonly used biomedical signals
The signals which are commonly used are:
The electromyogram (EMG): Electrical activity of the muscle cells.
The electrocardiogram (ECG): Electrical activity of the heart /cardiac cells.
The electroencephalogram (EEG): Electrical activity of the brain.
The electrogastrogram (EGG): Electrical activity of the digestive system dedicated to stomach.
The phonocardiogram (PCG): An audio recording of the heart’s mechanical activity.
The carotid pulse (CP): Measurement of the pressure of the carotid artery.
The electroretinogram (ERG): Electrical activity of the retinal cells.
The electrooculogram (EOG): Electrical activity of the eye muscles.
The bio-alerts of electric origin are made up of the integration of many action potentials. The action potential itself is the electrical ability, which is generated by one cell while it’s far routinely, electrically, or chemically inspired.
The action potential
The action potential is referred to as the mother of all of the biological signals. The action potential (AP) is the electric signal that accompanies the mechanical contraction of one cell while inspired by using an electrical current (neural or outside). It’s miles because of the flow of sodium (Na+), potassium (K+), chloride (Cl-), and different ion across the cell membrane. The AP is the simple element of all bioelectrical signals. It gives facts on the nature of physiological hobby on the unit-cell level. Recording an AP requires the isolation of one cell and microelectrodes with hints of the order of a few micrometers to stimulate the cellular and record the response. The biomedical alerts which might be generated due to the action potential are ECG, EEG, and EMG alerts. Co-ordinated electric activities and a specialized conduction gadget intrinsic and specific to the heart play a significant function in the rhythmic contractile pastime of the heart. The SA node is the primary, inbuilt cardiac pacemaker that triggers its very own train of action potentials. The action potential of the SA node propagates through the relaxation of the heart, causing a particular sample of excitation and contraction, as shown in Figure 1.1:
Figure 1.1: The wave form of the action potential at different location of the heart
The above figure shows the series of activities and wave in a cardiac cycle:
The conduction gadget of the coronary heart is managed through two nodes called the sinus node (sinus-atrial or SA node) and atrioventricular node (AV node).
The SA node is positioned within the proper atrium on the advanced vena cava.
The SA nodal cells are self-excitatory, known as pacemaker cells.
Pacemaker cells generate a movement ability at the charge approximately 70 per minute. The movement capability then propagates from the SA node at some stage in the atria but cannot spread directly across the boundary between atria and ventricles.
The AV node is placed at the boundary of the atria and ventricles. Within the ordinary coronary heart, the AV node gives the propagating course of action capacity from atria to ventricles.
From the AV node, the movement potential propagates to the ventricles through a specialized conduction machine referred to as a bundle of His, which named after German physician Wilhelm His, Jr. 1893-1934.
This bundle separates into the left and right package deal branches. These branches are then split into Purkinje fibers of ventricles.
The Electrocardiogram (ECG)
ECG is the graphical recording of the electrical activity of the coronary heart. Its miles the combination of many movement Potentials from particular regions of the coronary heart that makes up the ECG. The electric floor electrocardiograph (ECG) signal is generated by way of the coronary heart’s muscle and measured at the pores and skin floor of the frame. It has a super significance in analysis and tracking of the heart’s condition; therefore, it’s far the maximum usually used signal used for the evaluation. The ECG may be measured as a multi-or single-channel sign, depending on the utility. At some stage in the regular dimension of well-known scientific ECG, 12 one of a kind leads (channels) is recorded from the body surface (pores and skin) of a resting patient. In arrhythmia evaluation best one or ECG leads are recorded or monitored to investigate lifestyles-threatening disturbances in the rhythm of the pulse:
Figure 1.2: The ECG Waveform
The general waveform generated is as shown in Figure 1.2 which is labeled as:
P wave: Atrial depolarization
QRS complex: Ventricular depolarization
T wave: Ventricular repolarization
U wave: Repolarization of the Purkinje fibers
Baseline: The polarized state
Characteristics of ECG signal
The following waves and time intervals describe some essential features of the ECG signal; for example:
R-R interval: The R-R interval, measured between two successive R waves, represents the length of a complete cardiac cycle. It is the fundamental rhythm quantity and is used to characterize different arrhythmias as well as to study the variability of the heart rate.
PQ-interval: The PQ-interval is the time period from the onset of atrial activation to the onset of ventricular activation. The period of the PQ-interval is only weakly dependent on the heart rate.
QT-interval: The QT-interval is the time interval from the onset of the ventricular activation to the entirety of ventricular restoration. This interval usually is dependent on the heart price; it becomes shorter at higher fast charges.
QRS-complex: The QRS-complex reflects the contraction of the right and left ventricles. In a healthy heart, the QRS complicated lasts for approximately 70–110msec and is a pointy bi-or tri-phasic wave. The first weak deflection of the QRS complicated is the Q-wave, and the primary fantastic is the R-wave, even as the negative deflection after the R-wave is the S-wave. Also, the QRS-complex might have less than three-man or woman waves; it is although called QRS complicated. The morphology of the QRS-complex is pretty variable and relies upon at the beginning of the heartbeat: the period of the QRS-complex may additionally amplify as much as 250msec in an abnormally running coronary heart, and it is from time to time composed of greater than three waves. The QRS-complicated has an amplitude from time to time, achieving 2–3mV; its miles the most critical magnitude of the ECG sign. Because of the steep slopes, the QRS-complicated incorporates frequencies that are notably better than frequencies from different ECG waves. Its frequencies are broadly concentrated inside the range of 10–50Hz.
P-wave: The P-wave displays the sequential contraction of the left and the right atria. Usually, the P-wave has fine polarity and clean monophasic morphology. Its amplitude commonly remains under 300 μV, and its duration is less than 120msec. The spectral function of a normal P-wave is generally considered to be low-frequency, under 10–15Hz, however positive superior sign processing strategies that produce very noise-decreased ECG indicators have discovered, that a whole lot higher frequency additives might exist in a P-wave, especially in a few odd working-conditions of a coronary heart. Often it is tough to decide the time instants that outline the onset and the cease of a P-wave because of its low amplitude and smoothness. Therefore, the analysis of man or woman P-waves isn’t completed in ECG alerts having high noise.
T-wave: The T-wave reflects ventricular rest and extends approximately 300msec after the QRS-complicated. The placement of the T-wave strongly relies upon on the coronary heart fee; it becomes narrower and in the direction of the QRS-complicated at high rates. The T-wave is smooth and has an amplitude inside the variety of 100–300 μV. Its frequency content is much like that of the P-wave, with appropriate more potent low-frequency content.
ECG sign acquisition
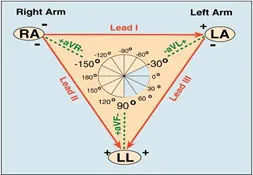
In scientific practice, the same old 12-channel ECG is obtained the usage of 4 limb leads and chest leads in six positions as proven in determine 2.three. The right leg is used to vicinity the reference electrode. The left arm, right arm, and left leg are used to get leads I, II, and sick. A combined reference called Wilson’s major terminal is formed by using combining the left arm, right arm, and left leg leads, and is used as the reference for chest leads. The augmented limb leads known as aVR, aVL, and aVF (aV for the augmented lead, R for the proper arm, L for the left arm, and F for the left foot) are received via the use of the exploring electrode at the limb indicated by using the lead call, with the reference being Wilson’ principal terminal without the exploring limb lead.
Recording of ECG
Figure 1.3 shows the Standard 12-Lead ECG. The ECG signal is recorded in three different electrode positions:
Standard Limb Leads I, II, III (Bipolar Limb Leads)
Unipolar limb leads (Augmented Limb Leads)
Unipolar chest leads
Each of the above lead gives a different reading. While recording, twelve readings are obtained where three from the standard leads, three from the unipolar leads, and six from the chest leads:
Figure 1.3: The standard 12-Lead ECG
Bipolar limb leads
The bipolar limb leads show the electrical differences between the positive and negative electrodes placed on the limbs as far away from the heart as possible. The electrode I, II, and III are attached to the left arm, right arm, and the leg. Each of these leads measures the voltage between two points on the body:
Lead I: Measures the voltage be...
Table of contents
Cover Page
Title Page
Copyright Page
Dedication Page
About the Authors
About the Reviewer
Acknowledgement
Preface
Errata
Table of Contents
1. Introduction to Biomedical Signals
2. Introduction to Arduino Mega
3. Digital Sensor Interfacing with Arduino Mega
4. Display Device Interfacing with Arduino Mega
5. Analog Sensor Interfacing with Arduino Mega
6. Introduction to Interfacing Arduino and LabVIEW Without Firmware
7. GSR Sensor Module Interfacing Using Arduino
8. Blood Pressure Sensor Module
9. Respiratory (Nasal Airflow) Sensor Module
10. Temperature Sensor Module
11. Body Position Sensor Module
12. Introduction to Interfacing Arduino and LabVIEW Firmware
13. ECG Sensor Module with Arduino
14. EMG Sensor Module with Arduino
15. Pulse Oximeter Interface with Arduino
Trusted by 375,005 students
Access to over 1.5 million titles for a fair monthly price.
Study more efficiently using our study tools.
Frequently asked questions
Yes, you can cancel anytime from the Subscription tab in your account settings on the Perlego website. Your subscription will stay active until the end of your current billing period. Learn how to cancel your subscription
No, books cannot be downloaded as external files, such as PDFs, for use outside of Perlego. However, you can download books within the Perlego app for offline reading on mobile or tablet. Learn how to download books offline
Perlego offers two plans: Essential and Complete
Essential is ideal for learners and professionals who enjoy exploring a wide range of subjects. Access the Essential Library with 800,000+ trusted titles and best-sellers across business, personal growth, and the humanities. Includes unlimited reading time and Standard Read Aloud voice.
Complete: Perfect for advanced learners and researchers needing full, unrestricted access. Unlock 1.5M+ books across hundreds of subjects, including academic and specialized titles. The Complete Plan also includes advanced features like Premium Read Aloud and Research Assistant.
Both plans are available with monthly, semester, or annual billing cycles.
We are an online textbook subscription service, where you can get access to an entire online library for less than the price of a single book per month. With over 1.5 million books across 990+ topics, we’ve got you covered! Learn about our mission
Look out for the read-aloud symbol on your next book to see if you can listen to it. The read-aloud tool reads text aloud for you, highlighting the text as it is being read. You can pause it, speed it up and slow it down. Learn more about Read Aloud
Yes! You can use the Perlego app on both iOS and Android devices to read anytime, anywhere — even offline. Perfect for commutes or when you’re on the go. Please note we cannot support devices running on iOS 13 and Android 7 or earlier. Learn more about using the app
Yes, you can access Biomedical Sensors Data Acquisition with LabVIEW by Lovi Raj Gupta,Anshuman Prakash,Dr. Lovi Raj Gupta,Dr. Rajesh Singh,Dr. Anita Gehlot,Rydhm Beri in PDF and/or ePUB format, as well as other popular books in Technology & Engineering & Electrical Engineering & Telecommunications. We have over 1.5 million books available in our catalogue for you to explore.